BTC/USD - A FIBONACCI RETRACEMENT PERSPECTIVE
Today we see another sell-off in the market. This need not be an immediate cause for concern, however, when one has insight into why the market is moving in a certain direction and when it may eventually change direction. To gain these insights, one can make use of fundamental and technical analysis. These are useful in analysing the current market movement and for providing a degree of clarity on what you should do in respect to your investment.
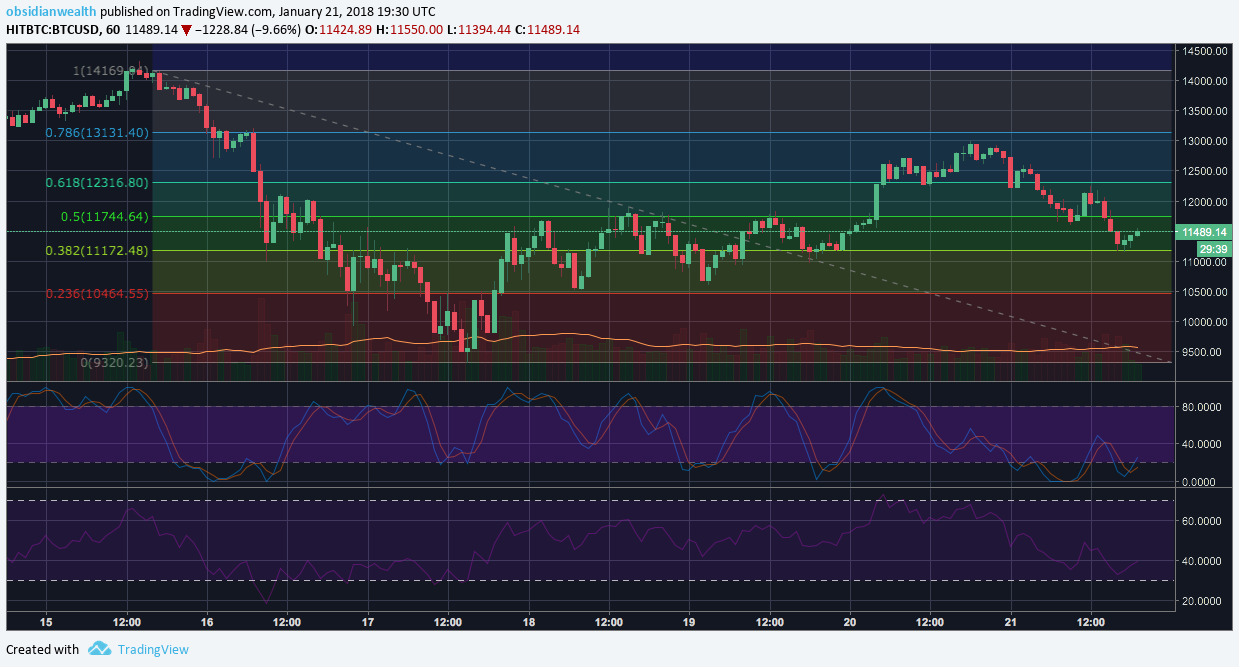
Three technical indicators have been applied to the below BTC/USD chart: (1) Fibonacci Retracement; (2) stochastic oscillator; and (3) relative strength indicator (RSI). Each of these give us different insights into what the market is doing.
For the sake of brevity, we will gloss over the underlying mechanisms of each of the above indicators, in order to focus on what insights can be gleaned from them in order to take up a position in the market.
Fibonacci Retracement
The Fibonacci Retracement (coloured horizontal lines) is an indicator comprised of different key levels which are identified by taking two extreme points (usually a major peak and trough) on a chart and dividing the vertical distance by the key Fibonacci ratios of 23.6%, 38.2%, 50%, 61.8% and 100% (read more at Investopedia).
These Fibonacci levels can be either support or resistance levels. A support level is a level which acts as a threshold against the price dropping any lower. In other words, the threshold “supports” the existing price or keeps it afloat. The converse is true for rising prices, the threshold in that instance is called a resistance level, and the threshold "resists" prices going any higher.

When we consider the Fibonacci Retracement, we see that between 18 January 2018 and 20 January 2018, the 50% level ($11744.64) has been a resistance level, with a sell-off taking place each time the price attempts to break that level. In this same time-period, the 38,2% level ($11172.48) has been a support level, and where the price drops below that, the 23,6% level has been a support level. We see the price action ranging nicely within the 23,6% to the 50% levels. The price of BTC then eventually broke the 50% resistance level, and rose past the 61,8% level which then became a support level as selling pressure prevailed.
As we come towards today we see that sellers broke the 61,8% support level and continued pushing the price down. A new support level formed at the 50% level once again, and we see price action oscillating between 50% and 61,8% as support and resistance levels respectively. At the time of writing this article, the 38,2% level has become the support level.
It useful to have an indicator such as the Fibonacci Retracement to help make sense of otherwise erratic price action. The value of the Fibonacci Retracement is enhanced when considered alongside the Stochastic and RSI indicators.
"It is always important to contextualise your investment decisions by looking at the micro and macro state of the market"
We see the two moving averages of the stochastic oscillator crossing-over in an overbought area around 09:00 GMT on 20 January 2018. This indicates a downward trend may commence. We then look to the RSI indicator which confirms this change in trend, as the RSI also indicates overbought market conditions. When lastly coupled with a Fibonacci Retracement support level of 61,8% which is continually being tested, we can anticipate a downward trend.
As to when this trend would come to an end, it is useful to consider the same, as well as other, indicators over a larger time period. The chart utilised here is a one-hour chart. A one day/week chart may help contextualise today's micro price action relative to the overall lifetime price action of the specific cryptocurrency. When combining insights from all these indicators, we can make better decisions on when the current trend may change direction.
Hence, it is always important to contextualise your investment decisions by looking at the micro and macro state of the market by analysing different time-frames, using different indicators, as well as reading up on your choice of cryptocurrency.
Congratulations @obsidian-wealth, you have decided to take the next big step with your first post! The Steem Network Team wishes you a great time among this awesome community.
The proven road to boost your personal success in this amazing Steem Network
Do you already know that awesome content will get great profits by following these simple steps, that have been worked out by experts?