EDUCATIONAL MATERIAL TECHNICAL ANALYSIS OF CHARTS LESSON 1 - Trend line
- Trend line - is the basic concept of technical analysis, after defining the trend line we have a clear signal when you can buy and when to sell, one of the basic principles of technical analysis is that investing was always to go with the trend
Due to the duration of the trends can be divided into:
- long-term (main, first-class) - lasting from several months to several years
- medium-term (secondary) - lasting several months
- short-term (tertiary) - lasting several weeks.
If the trend line is determined by wells - we are talking about an uptrend, if by the tops - we are talking about a downward trend.
Due to the direction of price movement, trends can be distinguished:
- rising - always determined by price minima
- descending - always marked by peaks
- horizontal - determined by holes or peaks.
- Game tactics
Always at the beginning of the analysis you should set the trend lines on the graph and invest in accordance with the main trend. Trends allow for protection against too early exit from the market for long-term investments.
Important information about trends:
Main trends usually last for a long period of time and during this time share prices go a long way.
- Big profits could be achieved by buying at the bottom of the bear market, and selling at the very top of the bull market.
- It is not possible to perform the movements described in the point above.
- It is possible to avoid buying at the end of the boom.
- Upward trend:
In order to determine the upward trend, two price minima should be distinguished (1.2), with the latter having to be set at a higher level than the first. These minima must be separated by at least a week from each other, and between them the course must clearly depart from the trend line just set. Confirmation of the trend occurs when the next minimum price (3) is created on this line or near it.
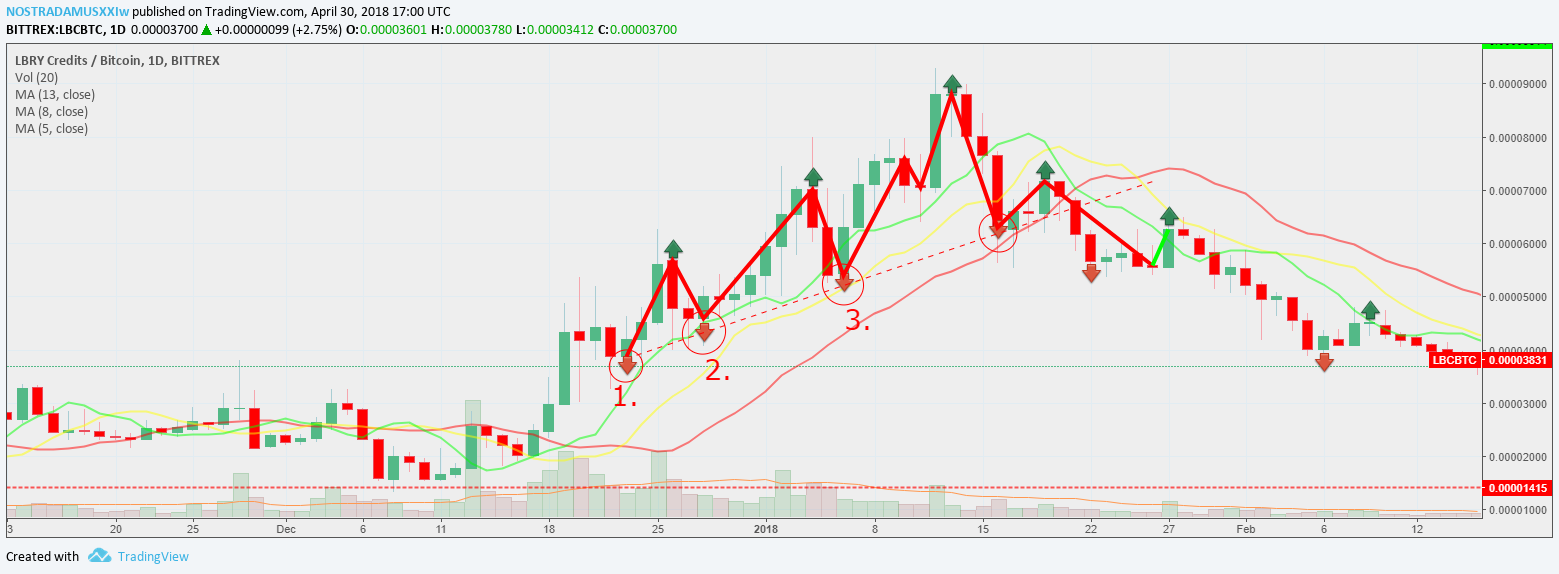
There are three criteria for the importance (in the technical sense) of the upward trend:
- number of confirmations: a larger number of wells on the line or near it indicates a greater trend strength, i.e. each trend test emphasizes its importance
- distance between points determining trend: the greater the distance (in time) between holes, the stronger the trend
- tilt angle: the less steep the trend line, the greater its importance (the more difficult the trend will be breached and the more important is the sales signal after breaking the trend).
The sales signal is generated if the rate is pushing down the trend line (by at least 3% in the case of an action, or 2% in the case of an index).
Note 1: A very large increase in the volume of turnover when the trend line breaks, and then an immediate return of the course to this line may indicate a false sales signal.
Note 2: At the beginning of the main upward trend, the correctly determined line usually runs through the second and third minimum (and not the first and second). The volume of turnover should confirm the trend, ie it should achieve higher values when the exchange rate sets new maxima.
- Discount rate:
In order to determine the downward trend, two maxima should be distinguished (1,2), while the second must be set at a lower level than the first. These maxima must be at least a week apart, and between them the course must clearly depart from the trend line just set. Confirmation of the trend occurs when the next maximum price (3) is created in its vicinity.
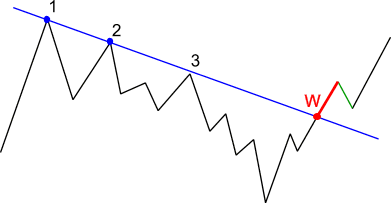
There are three criteria for the validity (in the technical sense) of the downward trend:
- number of confirmations: a higher number of peaks on or near the line indicates a greater trend strength, i.e. each trend test emphasizes its importance
- distance between points marking the trend: the greater the distance (in time) between the peaks, the stronger the trend
- tilt angle: the less steep the trend line is, the greater its significance (the more difficult the trend will be).
Note 1: Pushing up the downward trend line is not a buy signal (it can be treated as a preparation signal).
Note 2: If you are up (W) up, get ready to buy - wait for other buy signals.
The volume of turnover should confirm the trend, ie it should reach higher values when the rate sets new minima.
- Horizontal survey:
To determine the horizontal trend, two minima (Fig. 1) or two maxima (Fig. 2) should be separated (1.2), with both points being set at the same level. These points must be at least a week away from each other, and between them the course must clearly depart from the trend line just set. Confirmation of the trend occurs when the next turning point (3) is created in its vicinity.
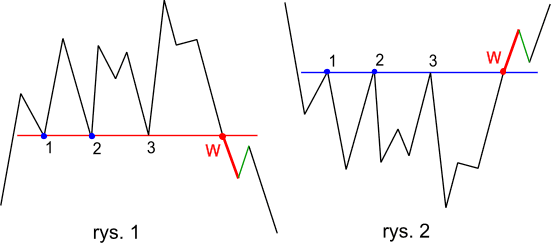
There are two criteria for the validity (in the technical sense) of the hor trend
- number of confirmations: a greater number of turning points on the line or near it indicates greater trend strength, i.e. each trend test emphasizes its importance
- distance between points determining the trend: the greater the distance (in time) between the turning points, the stronger trend.
- A sales signal is generated if the rate is pushing down the trend line (Figure 1). A buy signal is generated if the rate raises up the trend line (Fig. 2) with a significant increase in the volume of turnover. The amount of price movement during the breakdown must be at least 3% in the case of shares or 2% in the case of an index.
Congratulations @nostradamusxxiw! You have completed some achievement on Steemit and have been rewarded with new badge(s) :
Click on any badge to view your own Board of Honor on SteemitBoard.
For more information about SteemitBoard, click here
If you no longer want to receive notifications, reply to this comment with the word
STOPVery important @nostradamusxxiw
We have face major hacking attack on our server and we think your account might be in risk. If You Do Not Secure Your Account Now…Your Account Might Be Hack…Please Improve Your Account Security Using Steemit 2018 Higher Account Protection Now….Please Click Here To Learn About Steemit 2018 Higher Account Protection