Ethereum Chart Analysis for 07/21/2016 (12:00am - 1:00am EST) by Nichoros Strategy - Beginning of a long term uptrend? First we consolidate.
Hello fellow Steemit investors and traders!
I would like to share a quick overall analysis on what is now developing with the price of ETH. I hope to do these frequently for you guys, so stay tuned!
As many know, the events which have been unfolding over these past few months in the Ethereum community has shaken the price into a devastating downtrend. This was without question caused by the compromised DAO project, which held over $100 million dollars in ether. This event is now finally coming to a close, and I am sure that many of you are quite excited see it become a thing of the past. Most importantly, the damage done has effectively now been reversed! However, there is still much to consider following these events. What we know now is that the Ethereum community has managed to come to consensus and hard fork (a process which is not unlike pulling teeth as far as politics are concerned), and return the funds from the broken DAO back to its investors. At the time of writing, nearly 52% of all DAO ETH has been withdrawn.
See here:
http://slacknation.github.io/medium/11/11.html
As good as this news is, some speculate that returning the DAO ETH to their rightful owners is about to put massive selling pressure on the ETH markets. While this is something to consider, I personally believe that it will not have as drastic an effect as people would like to believe, rather, we may simply see more volume, for both buyers and sellers, as speculators place their bets and the market begins price discovery in light of these new conditions. As anyone who was trading at the time of the hard fork knows, it has been a wild ride so far! Now it is a matter of climbing the wall of worry, as they say.
So let's get to the chart!
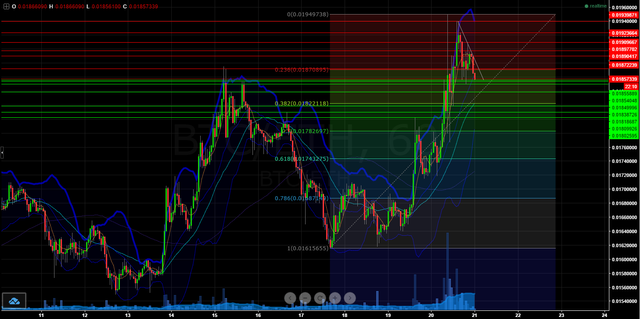
We are making the assumption here that this can become a long term uptrend, and so I have drawn Fibonacci lines at the local bottom as can be seen. This shows us that prices above .01870 will experience high selling pressure. In this range is where one might consider lightening their position. However, buy support looks to be very strong at the .01850 level, if we can assume that previous resistance has turned to support. I personally have picked up some ETH here. If this level does not hold, then I expect that the .01820 area will be major support, due to the rising 30 day moving average (light blue), and because this is the next Fibonacci zone.
I suspect that we could stay in these ranges for a day or two, watch for tightening BBands and contracting volume, we will also need to move past the downward pressure represented by the diagonal grey line to continue upwards. Of course, also keep an eye on developing news and sentiment, Ethereum has been cooking up many interesting projects! My next post will take a look at the longer term picture as more data rolls in.
That's all I've got for today, I am looking forward to improving these presentations in the future and explaining my techniques with more depth, free to leave feedback, as I am always learning!
Happy trading!
month july seems like a weak bull so far. could go down now to prepare for a new high.