NEO, XRP, and ETH Trade Analysis Charts For February
Here are some trade analysis charts that I found and feel are accurate
Neo / BTC
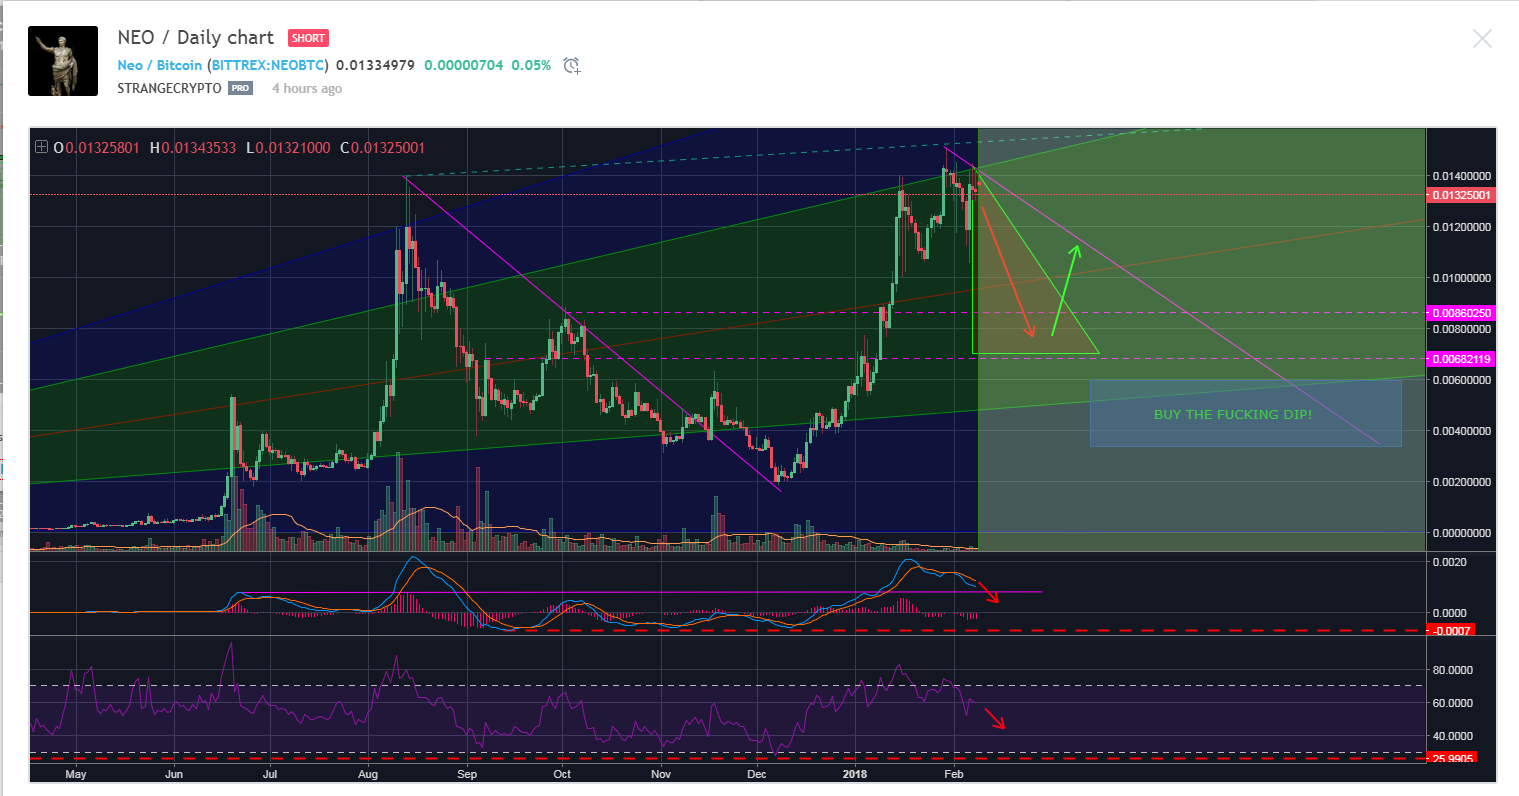
Neo is constantly on the rise until the recent dip, in fact if you bought the dip at $70 USD then you would be up nearly 50% in less than a week. It seems that another dip is likely to occur unless the purple trendline is broken. So get ready to trade any extra SBD you've accumulated for NEO which is a proof of stake coin and gives you GAS ;o
XRP Ripple/Bitcoin
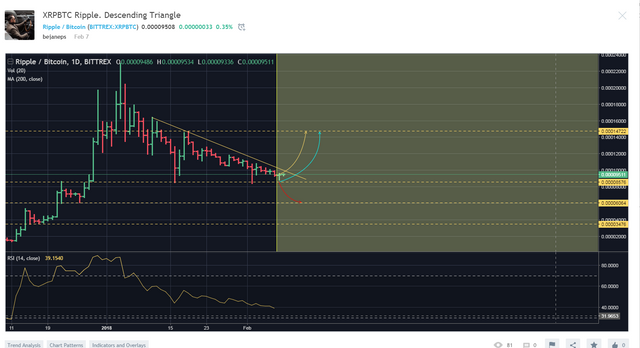
Ripple seems to be very close to breaking out of the triangle, if you see it stabilize above 10500 then that would be a good indicator that the bears have left the building. XRP/BTC could head back up in the 19k -28k range so keep a close eye on it.
ETH/BTC Ethereum/Bitcoin
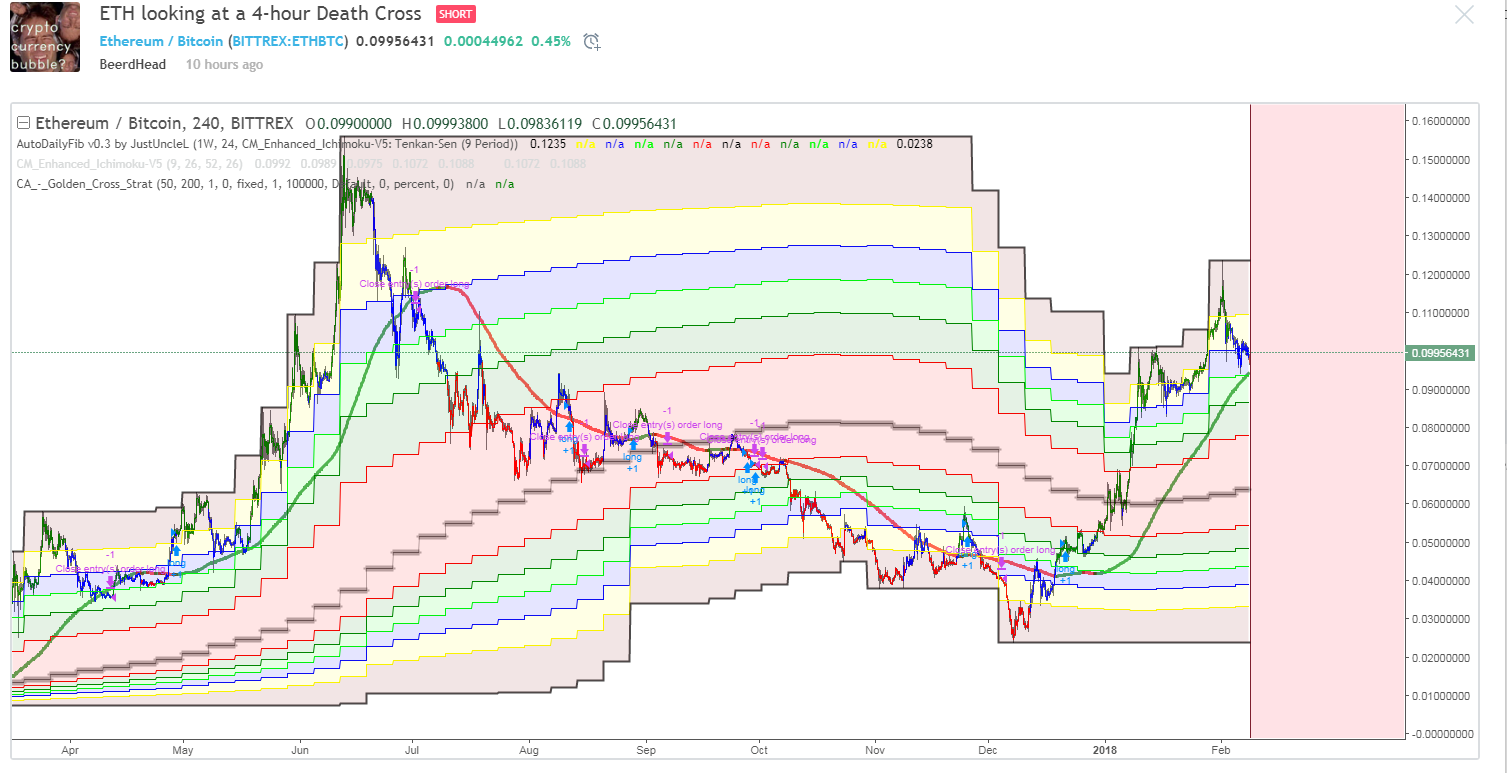
If you look at the previous moving average crossing, we saw a huge downtrend. ETH/BTC looks to be repeating history so be careful of any long trades with Ethereum.
The winners this week looks like Ripple as long as it stays above 10500
Happy Trading
Follow me @mybitcoinacademy
I really hope you are right :) good post. Thanks for sharing