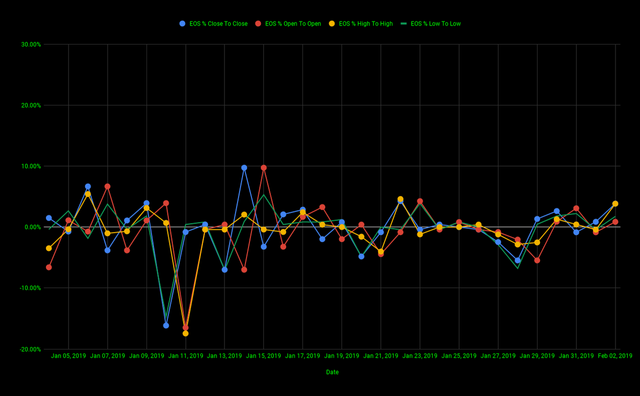
cryptocurrency
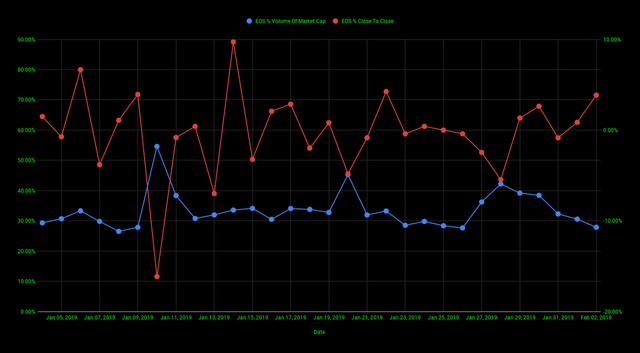
The chart below gives us a look at EOS's % volume of market cap (blue line) and EOS's % increase/decrease close to close (red line) for the past 30 days.
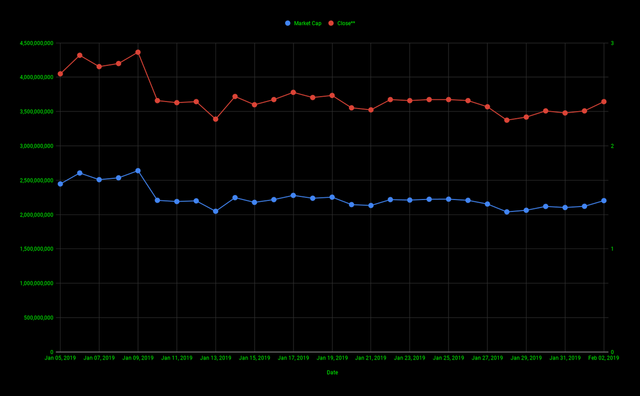
The chart below gives us a look at EOS's marketcap (blue line) and EOS's closing price (red line) for the past 30 days.
The chart below gives us a look at EOS's closing price (blue line) and EOS's volume (red line) for the past 30 days.