Litecoin Giving This Strong Bullish Signal After 3 Years Made Me Amazed | A Complete Long Term Analysis On LTC 2020
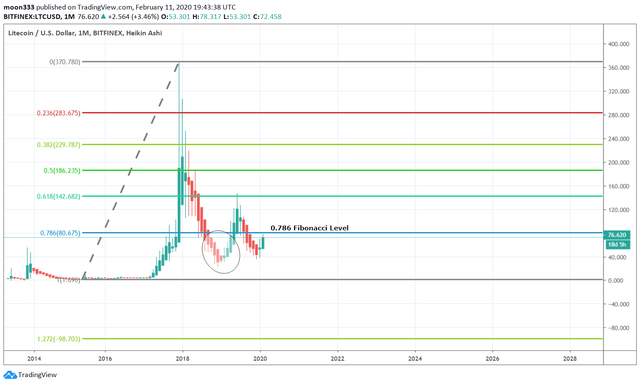
Because the ideal drop is considered up to 0.618 Fibonacci and once it has crossed more than 0.786 Fibonacci level then alarming situation starts and the price line can hit the 100% retracement.
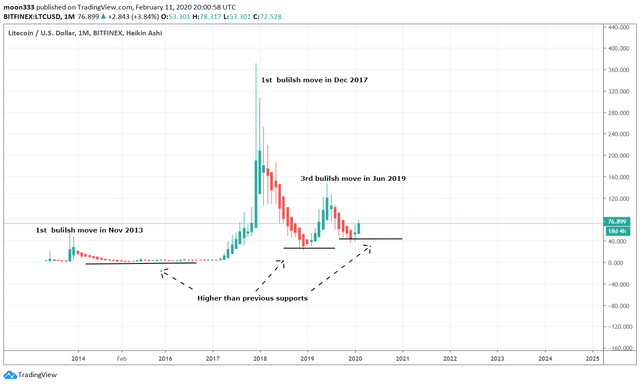
Forming Higher Lows:
But after hitting the lowest price after Dec 2018 at $22.54 the priceline found support at $29.76.
At this level the Litecoin had already lost 93% of its value then in Feb 2019 the LTC started moving up and up to Jun 2019 recovered 33% of its value by reaching $146 but from July to Jun 2019 the priceline again took bearish move and reached $36.10 the time the loss was 90% from highest price of $370.
But if we see from more bigger view than the priceline of LTC is making higher lows than the previous highs and making higher supports than the previous supports.
Below you can see Litecoin has major 3 bullish divergences in its history.
1st in Nov 2013
2nd in Dec 2017
3rd in Jun 2019
But after every bullish divergence the priceline has formed higher supports.
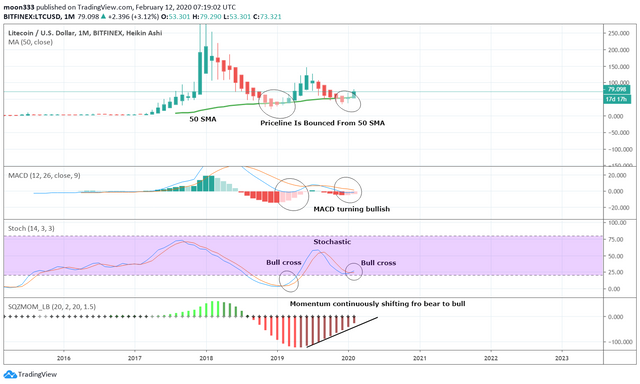
After Hitting 50SMA All Indicators Are Turning Bullish:
There is very interesting fact and that on month chart every time the price line is taking bullish divergence and making higher supports is mainly due to 50 simple moving average whenever it hit the 50 SMA it takes the bounce from here and forms higher lows.
And whenever the priceline hits the 50 SMA the MACD turns bullish and Stochastic give bull cross but the most significant signal here is that since May 2019 the momentum is being shifted from bearish to bullish even it has ignored the bearish move from July to Dec 2019 and continuously turning bullish without any interruption which is indicating towards some very big bullish move in future.
The Market Cap And Trade Volume Is Almost Doubled:
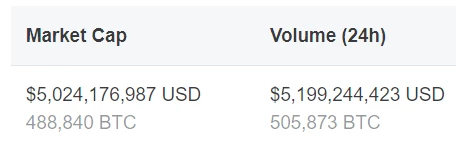
The bearish trend is likely to be finished now and if we see the marketcap of Litecoin (as per coinmarketcap.com) since the end of Dec 2019 then there is a significant difference at the end of Dec on 31st it was 2.63 billion and at the time of writing it is 5 billion showing 2.37 billion has been increased which is almost doubled since Dec 2019 to Feb 2020.
And if we see the volume then on 31st Dec 2019 it was 3 billion and today it is more than 5 billion.
This significant increment in marketcap and trade volume shows the interest of Litecoin holders and Traders is almost doubled which can lead to some major bullish move in near future.
Current Market Cap And Volume:
Market Cap And Volume On 31st Dec 2019:

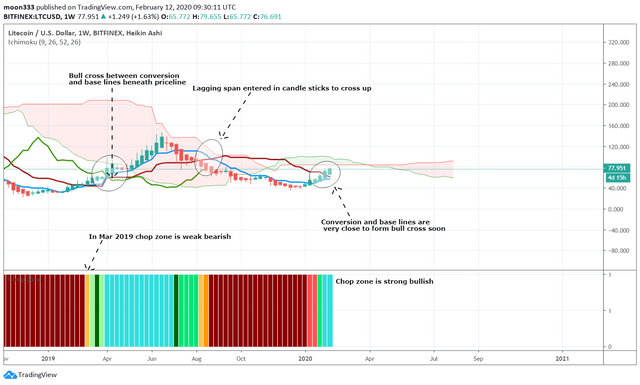
Ichimoku Cloud Is Turning Bullish And Bearish Trend Is Chopped:
On week chart the ichimoku cloud was turned strong bullish in Nov 2019 and gave a clear trend reversal signal from bearish to bullish trend and again reversed to bearish but lagging span is still moving up and entered in candle sticks to cross up and conversion and base lines are very close to form bull cross soon strong bullish green colored candle sticks are moving up and crossed up the conversion and base line and likely to cross up the bullish cloud soon.
And bull cross of conversion and base lines beneath the priceline is always thought to be very strong bullish signal for instance we can see the bullish cross of Mar 2019 even though the lagging span was moving down and there was strong bearish cloud above the price action but due to this bull cross formation below the price action pushed the price action from $45.41 to $146.95 that was major gain of 224%.
This time we have more strong situation because lagging span is already crossing up the price action, and conversion line and base lines are very close and cloud is bullish above the priceline, moreover in Mar bullish rally the chop zone was weak bearish but this time the chop zone is already strong bullish.
A Very Big Bullish Signal Being Appeared After 3 Years:
Now I am gonna talk about a signal which made me pretty amazed and increased my excitement.
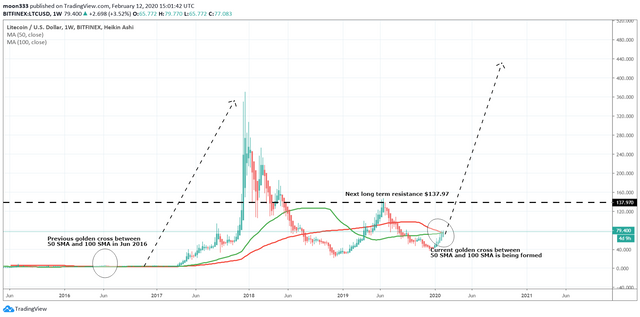
On week chart simple moving average with time period of 50 is forming a golden cross with 100 SMA and priceline is also likely to cross up these two simple moving averages.
This bull cross is being appeared after 3 years, before this it was formed in Jun 2016 and this golden cross leaded the price from $4.39 to $370.78 within 18 months and this was really massive gain of 8346% in simple words if someone invested 100 dollars he earned 8346 dollars.
Let’s see how much this time it will produce if we will receive a complete bull cross between 100 SMA AND 50 SMA.
At this time the priceline is also facing resistance by 50 SMA and 100 SMA if the Litecoin will breakout this resistance then very soon it can hit the next resistance level at: $137.97 that is 74% from here.
I will keep posting new updates on LTC when receive more developments.
My social links to follow:
Tradingview link: https://www.tradingview.com/gopro/?share_your_love=moon333
https://steemit.com/@moon333
https://p2pb2b.io/referral/376549a8-b6e9-4ae7-82c8-34cdba324ebc
https://www.publish0x.com/@moon333
Facebook: https://m.facebook.com/Moontriple3
Twitter: https://twitter.com/moon33367268705
Youtube channel for signals and trading educational videos: https://www.youtube.com/moon333
Telegram signals: https://t.me/moontripple3