Market review, January 15, 2019
The LedgerX trading platform considers Bitcoin volatility to be a very important benchmark for traders, so the company announced the launch of a new index that will track this parameter.
The index, called the LedgerX Volatility Index (LXVX), will track the expected bitcoin volatility. Data for LXVX will be taken from adjustable Bitcoin options, which have been traded by various institutional clients for a year.
According to the president and chief risk officer at Ledger X, Juthica Chou, the new index is similar to the CBOE (VIX) exchange index, which tracks the expected volatility of the stock market.
According to Chou, LXVX can be described as “Bitcoin Fear Index,” and this is also similar to VIX. As a former volatility trader at Goldman Sachs, Chou stressed the importance of such an index for the stock market, which pushed the LedgerX platform to create LXVX.
“If we take into account the beginning of the year, LXVX dropped by 20% to 68. This is about three times more than the volatility of the stock market, but very significant for Bitcoin - the level of fear and uncertainty has decreased markedly, for example, compared to December last year”, said Chow.
At the moment, the index is not a tradable product, but the creation of such a product is also listed in the company's plans. Institutional clients of LedgerX gained access to the new index several months ago, and now LXVX is also available to the public on the company's official website.
Note that the trading volume on the LedgerX platform since its foundation in October 2017 has exceeded $500 million. In May last year, LedgerX launched a simplified interface that allows cryptocurrency investors to get interest from their savings.
Now, let's move to the technical analysis of Bitcoin (BTC):

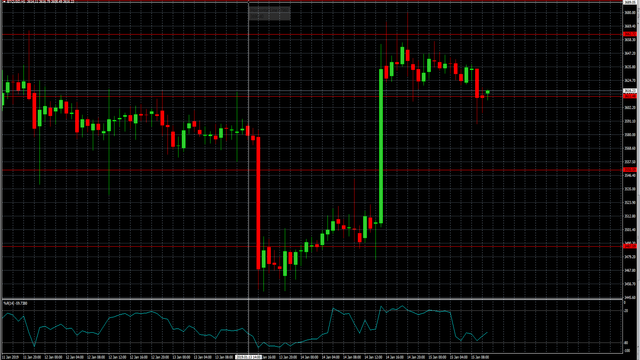
Over the past day, Bitcoin rose to the resistance level of $3,661. Current price of bitcoin rolled back to $3,590. Probably, bitcoin will grow to the resistance level of $3,740. The nearest resistance levels are $3,660, $3,690, $3,740. The nearest support levels are $3,600, $3,550.
Technical analysis of Ethereum (ETH):

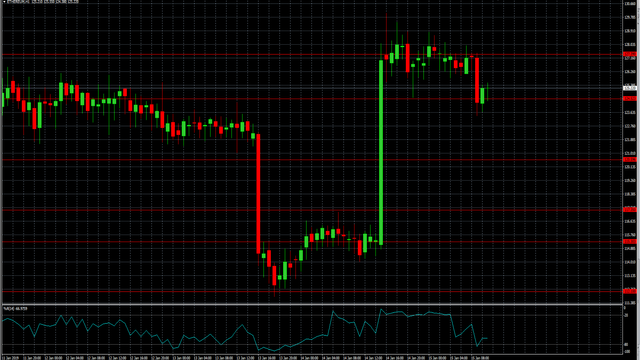
Over the past 24 hours, ethereum broke through all the expected support levels of $117, $120, $125, and even hooked the $130 mark. From this mark, it went down for a technical correction. It reached the resistance level of $123 and, apparently, the price increase will not stop at this level. We can observe the ascending trend. The nearest resistance levels are $128, $131, $138. The nearest support levels are $125, $120, $117.
Technical analysis of Ripple (XRP):
