Project: Crypto Investing Profit Simulation from Historical Data (1)
What should you expect when you invest equally into top crypto assets? I've done simulation with historical data which can be found from coinmarketcap.com.
Coinmarketcap.com provides weekly historical snapshot from 20130428. It's available from:
https://coinmarketcap.com/historical/
Unfortunately, coinmarketcap.com doesn't provide access with API for now, so I had to download the individual web pages and parse it. For easier access, I stored parsed data to a MySQL database.
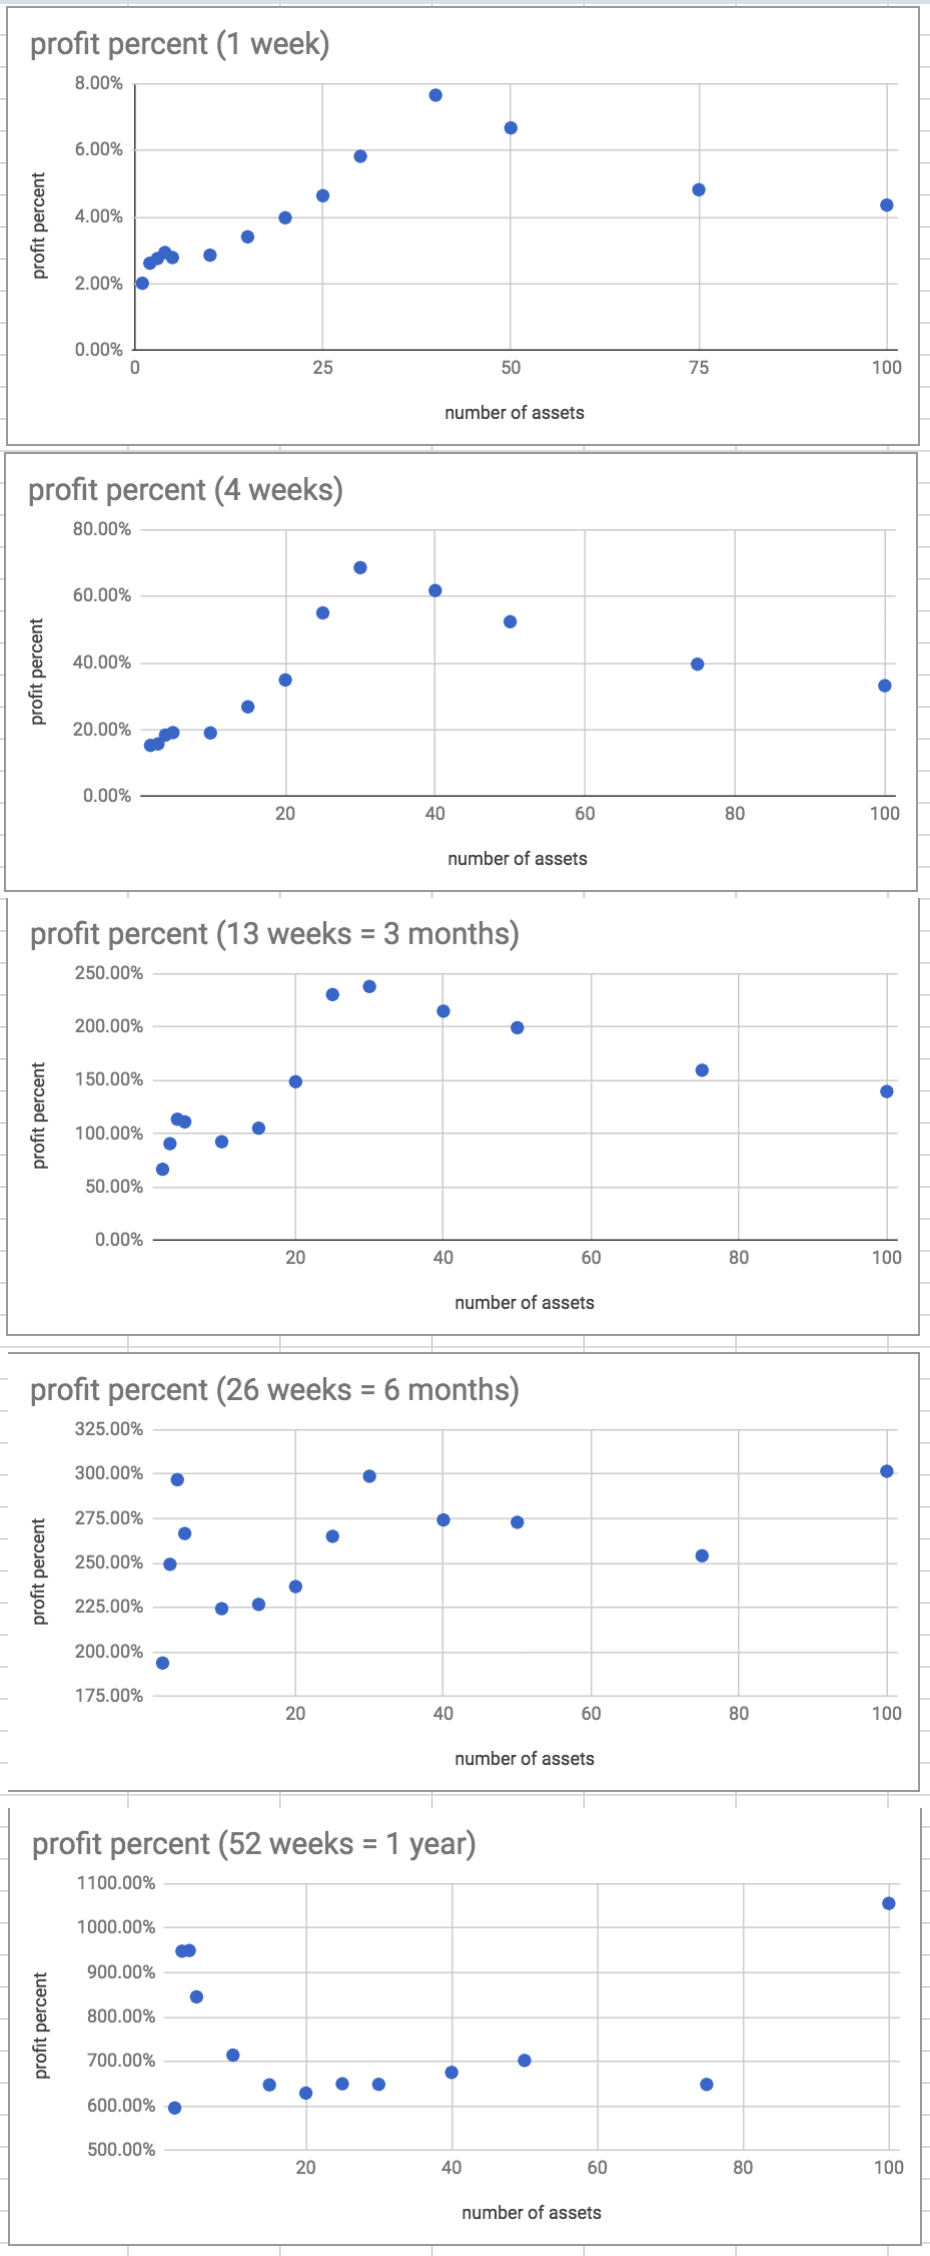
The simulation checks profit when you invest in top N currencies equally for W weeks.
The code I wrote simulates all possible date ranges from the date range, and calculates average. Results show gain in most cases. But, it does NOT mean guaranteed profits!
Simulated Data:
N(number of assets) = 1, 2, 3, 4, 5, 10, 15, 20, 25, 30, 40, 50, 75, 100
W (invested weeks) = 1, 4(1 month), 13(3 months), 26(6 months), 52(1 year)
So when N=10, W=4, it calculates all week ranges for the available date ranges. Here's some output for year 2018 only. It invests $1000 for each of the top 10 assets and then calculate the average profit.
20180325 - 20180422 : 31.48% (10000 -> 13148.044366876584)
20180318 - 20180415 : 19.73% (10000 -> 11973.12204540916)
20180311 - 20180408 : -30.47% (10000 -> 6952.5024362793)
20180304 - 20180401 : -44.99% (10000 -> 5501.221513669303)
20180225 - 20180325 : -29.52% (10000 -> 7048.044034460366)
20180218 - 20180318 : -47.83% (10000 -> 5216.944692338871)
20180211 - 20180311 : -17.59% (10000 -> 8241.111263120958)
20180204 - 20180304 : -7.85% (10000 -> 9214.817775503678)
20180128 - 20180225 : -30.46% (10000 -> 6953.755296558646)
20180121 - 20180218 : -18.57% (10000 -> 8143.29564816349)
20180114 - 20180211 : -48.53% (10000 -> 5147.133734185058)
20180107 - 20180204 : -51.47% (10000 -> 4853.084959657676)
profit(4w, #10) = -23.01%
in/out = 120000/92393.0777662231
Here's some general insights I could extract from the simulation results:
- The longer you hold your assets, profit increases.
- Holding top 30-50 assets had most profit for short term investing (< 3 months)
- If it's held for longer period, investing in top 5 performed well.
Below google sheet contains the simulated results:
https://docs.google.com/spreadsheets/d/1XZ_OK4IWg00RS3WSYbiItmfDTPTNOrR5ZoUkrWeo0ug/edit?usp=sharing
You could also find simulation for recent data only inside the sheet. (2016-current, 2017-current, 2017 July-current)
I'll share more data and maybe open source the code. Please comment if you want to see particular simulation results.
Please upvote and resteem.
The result presented here are calculated using historical data and does not mean anything about the future.

Thanks for the historical data...Really once again awesome work done by you man!
Thanks. Next post will be more eye catching :)
Great project..Great work
The data validated everything I believe in, when talking about trading stratigies.
Making many day trades never resulted in profits for me. My sweet spot was holding for 3-7 days. Working with the flow of the market, rather than against it, was always my goal.
Nice data here.
Also from my experience, it's more profitable to invest than trade. I'm not actively trading anymore. But I'm studying technical analysis, since it is useful for getting in and out of the market.