Bitcoin Mayer Multiple
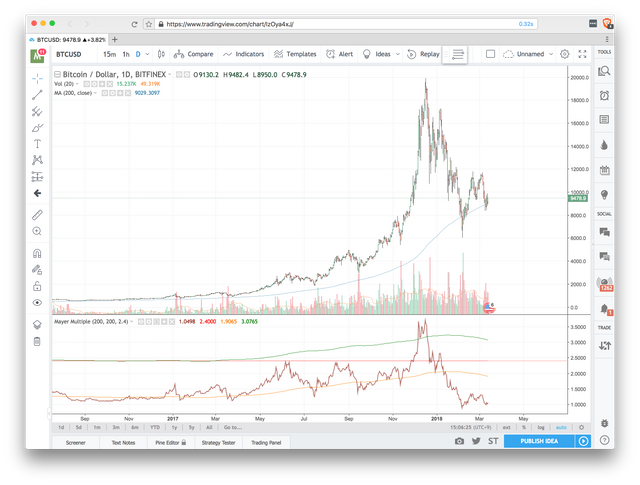
Mayer Multiple is a simple index for Bitcoin introduced by Trace Mayer. It compares current price with 200 day moving average. If the current price is on the 200 day moving average the value is 1. If the price is twice the moving average it's 2.
The average Mayer Multiple is 1.47 for the history of Bitcoin. 75% of the time it was above 1.0 meaning that Bitcoin is generally on an up trend. Using some analysis, it is risky to buy Bitcoin when Mayer Multiple is above 2.4. Every time the Mayer Multiple has gone above 2.4, it has returned below 1.5.
Currently, the Mayer Multiple is hovering around 1.0. It is better time to buy Bitcoin then when Mayer Multiple was over 2.4. This is not financial advise and I'm not a financial advisor!
You can find more detailed analysis from https://www.theinvestorspodcast.com/bitcoin-mayer-multiple/.
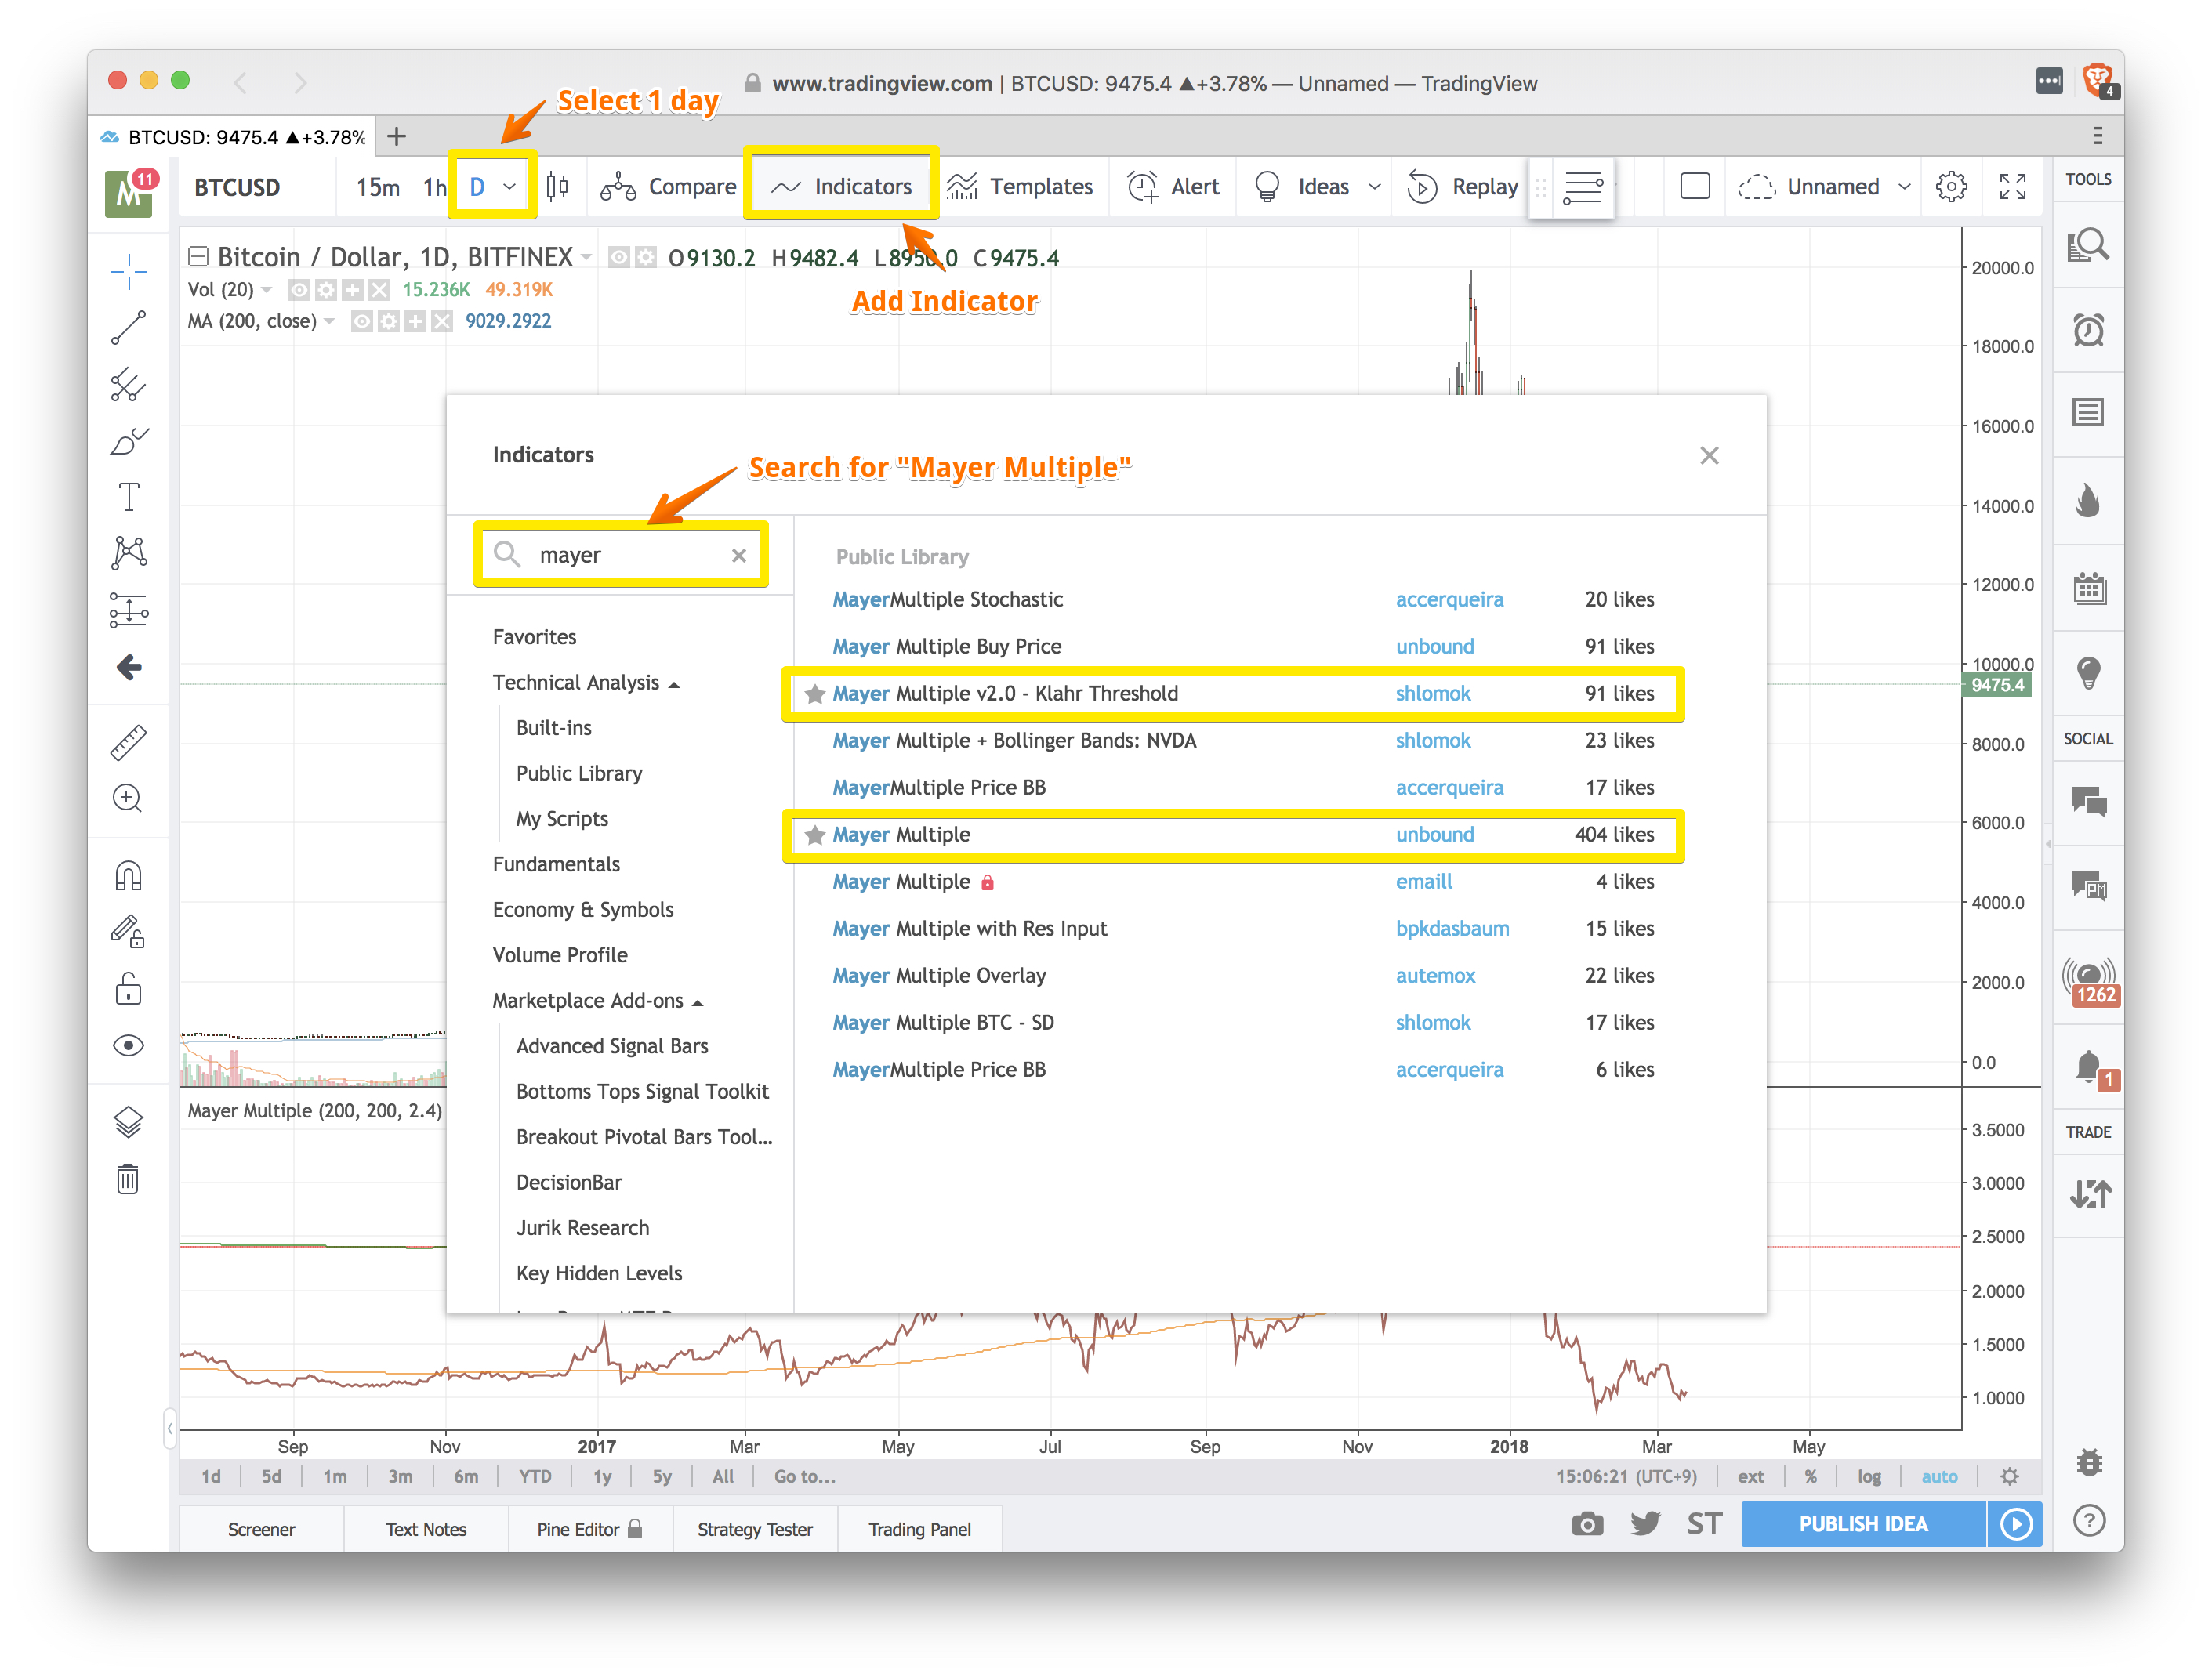
There are some scripts you can add to your TradingView so you can see the current Mayer Multiple. Open BTCUSD chart and set time interval to 1 day. Then select indicators and search for "Mayer". I liked scripts by unbound and shlomok.
You can see the source code for the script by selecting "Pine Editor" from the bottom bar. The source code is pretty straightforward.


Thanks for the info @mix1009.
The Mayer Multiple is the ratio of the current price to the 200 moving day average. They then model that with a simulation to figure out when buying bitcoin is profitable.
thanks for this @mix1009
Keep this up, Followed you for more :)
That’s a cool way to track the 200MA. Makes it a little more simplistic to just look at a number. No need for complicated charts.
Thanks for sharing.
Thank you for the nice comments. I do some technical analysis but it was way too fragile and stopped trading. I'm looking more into fundamentals of blockchain.