Crypto Trading Tutorial - How to read Japanese candlesticks
Japanese Candle Sticks are the sign language of the markets and understanding terms like morning star candlestick and hanging man candlestick can be an invaluable skill for your trading arsenal.
Whether you trade crypto, stocks, heating oil, gold or currency, learning to "listen" and understand what the candles are "saying" will give you a powerful edge in your trading.
Candles tell a story and my Japanese candlestick tutorial will teach you to read what they say.
Candles have been around a long time.
Created by the Japanese sometime during the 1600's, candle sticks where used to analyze the price of rice contracts.
Japanese candle sticks animate what are otherwise technical price records by painting a colorful picture thus creating a visual representation of price history.
Candles record the emotion of the markets.
Simply put, candles are the sign language of the cryptocurrency markets.
They are constantly telling a story and the day you are able to effectively read them is the day your trading will improve dramatically.
A candle simply records price movement for a unit of time.
If you are looking at a one hour chart then each candle represents the price activity for one hour. If you are looking at a day chart then each candle would represent one day and so on.
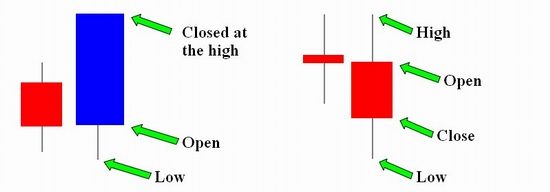
Candles are comprised of the BODY and an upper and lower wick.
Not all candles have bodies.
Not all candles have both wicks or sometimes they will have no wick at all.
Looking at the picture above we can see that:
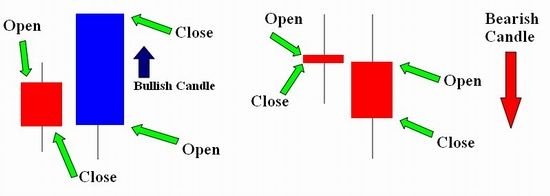
1 - On the bullish (blue) Candle the opening price is lower that the close. This tells us prices where going UP while that candle was open. Sometimes bullish candles will be green on the chart.
Another way to look at it is that there was more buyers than sellers.
2 - The red bearish candle's close is LOWER than the high. This tells us there was more sellers than buyers while this candle was open so the price fell.
The tips of the upper and lower wicks are the extreme highs and lows for that candle.
If the low is also the close, there will be no lower wick.
If the high is also the close, there will be no upper wick as is the case with the blue bullish candle above.
Bullish and Bearish Candles
The close on a bullish candle is always higher than the open.
The close on a bearish candle is always lower than the open.
Decision and Indecision Candles
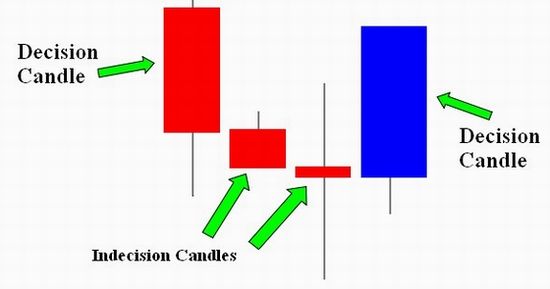
Full bodied candles are considered "decision" candles, a decision candle tells us the market has made a decision to go in a particular direction.
Indecision candles are candles with little or no body at all. These candles tell us the market cannot make up its mind which direction it wants to go.
Look at the picture above. Note the left hand red bearish candle opened and while the candle was open, prices continued to fall producing a long red body. This is a decision candle. The market knew where it was going and that direction was down.
During the life of the next candle the direction was not a sure. Notice the smaller body and the small upper wick.
This candle tells us that although the price continued to fall, it may be slowing down.
The next candle often referred to as a "Doji," is the grand daddy of indecisive candles.
Notice how price climbed up and fell way down before closing just about the same place it opened? Dojis usually have long wicks on both sides and a very little or no body at all.
This Doji candle is giving us a clue...
Continued in part 2.
Hi I'm Michael,
This post was adapted from some chart reading tutorials I created for one of my Forex websites. Used in conjunction with other trading tools like support and resistance, Fibonacci levels and chart patterns, candlesticks can help offer additional insight into the mood of the market you are trading.
If there's enough interest in this, the next tutorial will look at some popular candlestick patterns.
If you like this post please upvote it and subscribe.
If you would like to see more tutorials like this please consider reesteeming it.
I'm very new here and I only want to post content the community has an interest in.
All the content above was 100% created by me including the pictures.
Thanks for your attention :o)
Michael


Thanks for this Michael! I'm new to crypto trading and there is a lot of overwhelming stuff to learn. Posts like this lift a weight off someone in my place. Its clear, simple and I know what I'm looking at now. Well done.
Thanks man, I appreciate the feedback :o)
Hey thanks Michael, I have been really interested in crypto trading but the last couple of weeks, I have just been going off of my instincts. To a new trader, I am starting to realize that this is not the way to go. I joined steem a couple of weeks ago, but I havent really gotten around to joining the community yet. It was pretty cool to type into Google, "candlestick" charts, and up popped a "steemit" post by you! you have definitely caught my attention and I'd like to hear more of your articles, Good Job!!!
Hey thanks for the comment bud, I've been away for a few months and came back with 100 more followers so maybe it's time to make another post :o)
If you want to start investing in cryptocurrency join Coinbase and get $10 Free Bitcoin.