Is it too late to buy NEO ? What does the Ichimoku tell us?
NEO has been on quite a run recently. I was wondering if it's too late to enter this run? What is NEO upto ? Has it's fortunes turned? Is this NEO overturning all the China FUD?
So, to understand, we start with the 1 Day chart. The macro view.
https://www.tradingview.com/x/yUpjSyg0/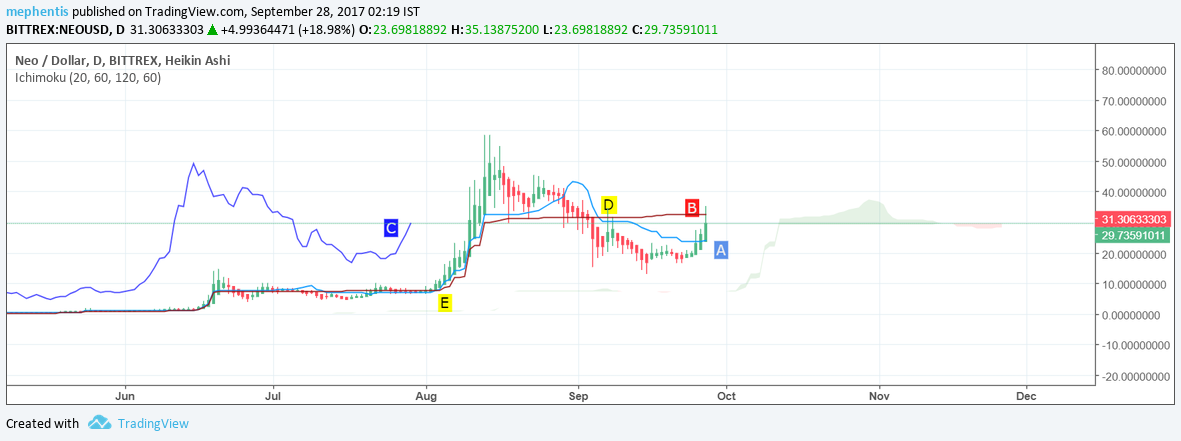
There us a A/B (or technically T/K) cross over over at 'D', when , on 05.09.2017, 'B' comes above 'A', signaling a negative sentiment. The sentiment has not changed, though, with the latest jumps, the price has crossed 'B'. 'C' is well above the price and looking up. To enter a trades, I would wait till 'A' crosses 'B' from below, signaling a change in the crowds view. If this happens, it would signal a buy in bull territory. This is what want to see before going long.
The last time we got such a signal was point 'E', on 04.08.2017, when the price was around $10. This run topped out at $58 ten days later. Look at this closeup of the same chart :
https://www.tradingview.com/x/aPFV0jgW/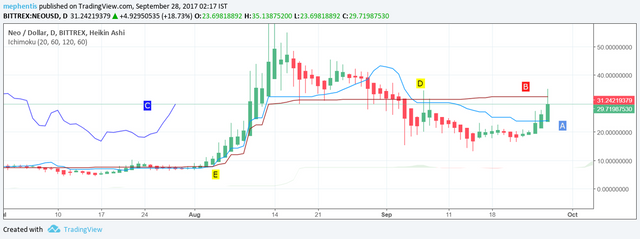
So, for long time holders, we wait.
Now for the 12 Hour Chart.
https://www.tradingview.com/x/wZsNacPk/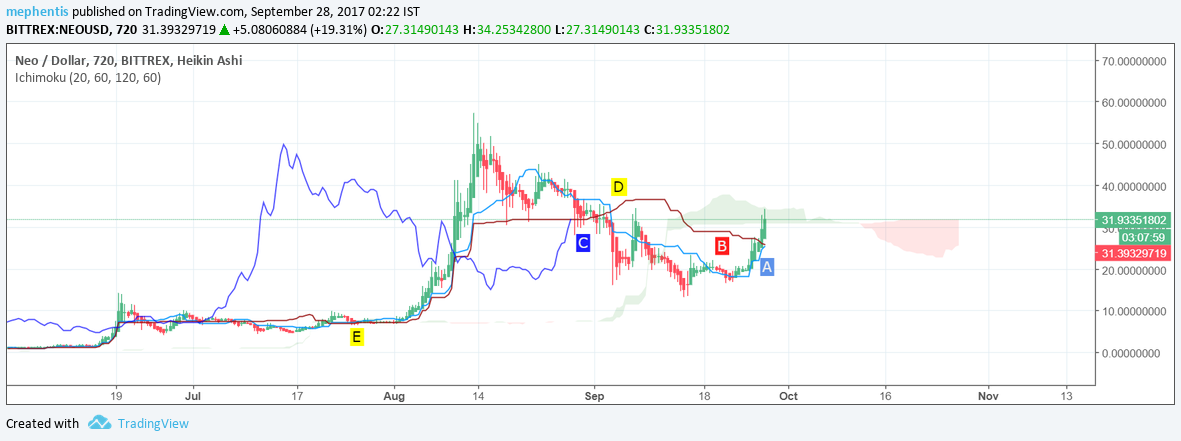
The signal at this zoom is also wait. 'C' is under the price , 'A' and 'B' lines. 'B' is still above 'A', though 'A' looks poised for a cross over. The price, meanwhile, is trying to break free of the cloud. Keep in mind, once the cloud always acts as a point of resistance. So, for there to be a long signal, 'A' would need to be above 'B', 'C' above the price and the lines, and the price should be above the cloud. Many steps away.
So, we wait.
On a side note, to understand how to read different zooms/ time frames of the same chart using ichimoku, note how we get the cross over at 'E' on 26.07.2017 (over a week before we got it in the 1 Day chart ).
Zooming into the 6 Hour zone, we find this -
https://www.tradingview.com/x/IXOVVCFJ/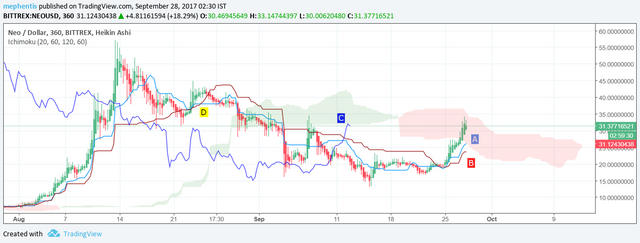
'A' has managed to cross over 'B' , though, in bear territory, which is a weak go long signal. But, its still a long signal. Price is in the red cloud, fighting against negative sentiment to break on through to the other side. It will need more momentum to carry it through.
'C' on the other hand is free of the prices and lines, but below the cloud. Note how 'C' ricochets off the cloud, a cloud that was projected/ predicted by the Ichimoku system into the future. Basically the cloud is a predictive resistance zone. Fascinates me every time I see this happen.
In sum, still no clear entry point.
Lastly, the 3 hour chart :
https://www.tradingview.com/x/LEYfO3nZ/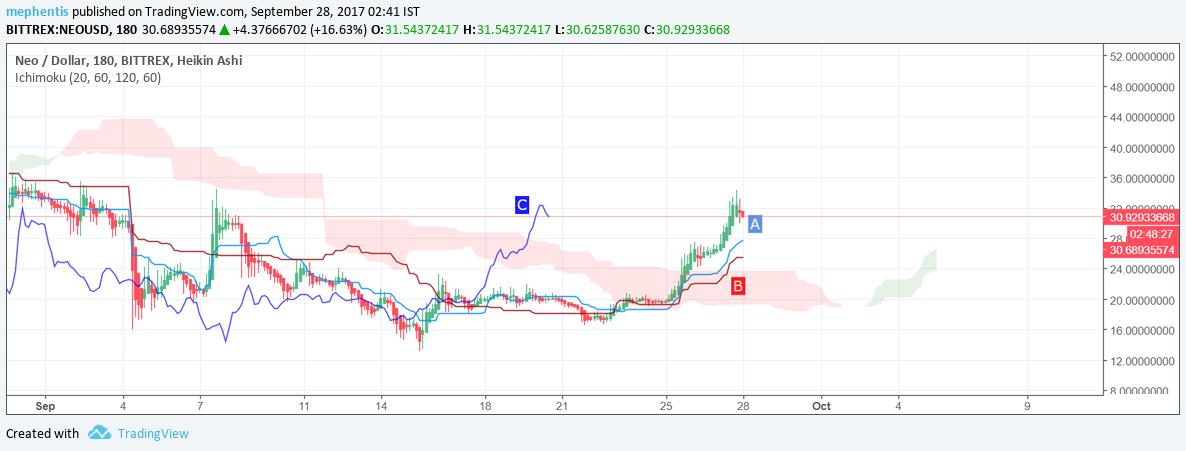
This shows a nice clear reversal in trend. 'C' is clear of the price and the cloud. 'A' is above 'B', though the cross over happens in the cloud, so that's a medium signal to go long.
So do you enter at this point? We'll, see how far the price has strayed from the 'A' and 'B', that means the price is out of equilibrium. It's almost 25% above 'B'. As a rule, your stop loss, when going long or short, should be just below (or above) 'B'. I would wait for the price to come closer to 'A' or if you're patient , to 'B', and when it bounces off 'B', i would enter, with the stop loss a few points below 'B'. An ideal price to have entered would have benn when 'C' broke out of the cloud. Since then it has moved up 15% before hitting the bottom of the cloud at the 6 Hour zoom.
So there we are. If you're looking for a quick in and out, you're a little late. If you want to go long , wait for clearer signals, especially from the macro stand point.
Hope this helps. Please let me know if you agree, disagree or want to add something.
Cheers.
I'm going long. NEO has the power of Japan behind it. I give free buy signals for bittrex and poloniex. Feel free to follow.
NEO has been a long term hold for me since it's logo was a cute little ant with antennae on it. It's well worth accumulating on dips, like the one we just had.