Monitoring your mining rigs with Free Splunk and Slack Alerts
Introduction:
This post aims to teach you how to keep your own historical data of your mining rigs logs in your own private Splunk instance then monitor and send you automatic alerts with current hashrates to Slack, it can be setup to alert you if one of your rigs stop mining.
I don't know about you but i have a bad habit of watching my miners throughout the day when i really have other things to do and it's just so counterproductive to do that. Generally once a miner is up and running you don't need to touch it or interact with it unless there is a problem. The killer is if your miner is down for days without knowing there are many $$$ reasons this is bad.
Most importantly i should note that I am no splunk expert, i use it at work and like to build my knowledge with my tools of the trade especially with stuff i am actually interested in, there are probably better/more correct ways to do this so sorry if i've done things a bit oddly.
Is this necessary:
Nope. But seriously if you got into mining you probably you did so by calculating hashrates vs return vs electricity cost and made an informed and educated decision to start mining, or you just thought it was cool and took a punt, either way most of you probably want to know as much about your miners as possible. Setting something up like this will help.
Pre-requisites:
- Splunk free (currently v6.6.2) installed. (splunk is free up to 500mb per day) download it here and follow the install guides, this is easily installed on ubuntu i find, it normally takes me 30 min and that includes installing the OS. https://www.splunk.com/en_us/download/splunk-enterprise.html
- A private slack instance or one you can enable an incoming webhook integration on. Details are here: https://api.slack.com/incoming-webhooks , make sure to take note of your webhook URL: https://hooks.slack.com/services/[your unique code]
- Install Slack Notification Alert App from Splunkbase in your Splunk instance. https://splunkbase.splunk.com/app/2878/
- An account on a mining pool that supplies a API with JSON feed for Splunk to ingest. We will use ethermine.org for this so take note of your API URL: https://ethermine.org/api/miner_new/[your payment address]
Lets get the data into Splunk:
First get logged into splunk and on the front page or from Settings select Add Data

Select Monitor

Select REST

Click Next
- Give the Input a name, this can be anything and is just for your reference.
- Add the specific API URL you took from the website of your mining pool and paste it in Endpoint URL.
- Change the response type to JSON
- Create a manual sourcetype just to make searching easier, there are other ways to do this but i like it this way.


Click Next and you are done with the data input phase.
Reporting/Dashboard Setup:
So now it's time to test your input is being collected into splunk. Go back to the main search page http://[splunkIP]:8000/en-US/app/search
Type into your search sourcetype=ethermine or whatever sourcetype you used when you created the input.
You should see something like the following if all went well:
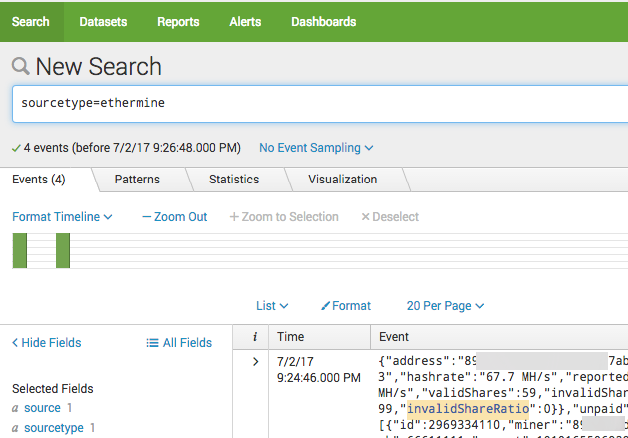

So if you see this or similar then you are ready to setup a dashboard and alerts.
Lets cleanup the raw data and make our summary contain what we need.
Click on the down arrow in the “i” column and scroll down until you find the workers fields, this is where you will gather the search fields for your dashboard and alerts. You may want to relocate some of the fields to the main summary search window for each search result to save you opening the results and scrolling all the way down each time you check a result, so select each field you want to have easy access to and they will rise up to the top into the summary area and you will not need to expand the raw data each time you need it.
Now you will see in the above image rig03, this is the name of my worker so let’s create a dashboard for rig03 and show the last known hashrate.
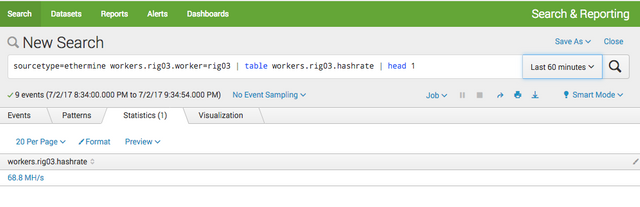
To do this we create a search for the worker and the hashrate field using the search string below.
sourcetype=ethermine workers.rig03.worker=rig03 | table workers.rig03.hashrate | head 1
Lets break that down:
- sourcetype=ethermine workers.rig03.worker=rig03 gives us all results where our data input is ethermine and our worker is rig03
- table workers.rig03.hashrate creates a table for the last 60min with the hashrate field based on the previous search results.
- head 1 returns the latest result only.

Click Save As > Dashboard Panel

Select New, give the Dashboard a Title and then give the new panel a name like Ethermine Hashrate and click Save

Click View Dashboard to take a look.
Now that looks ok but the Hashrate is too small right?
Click Edit > Edit Panels on the dashboard screen. Then select the grid image on the panel then select the Big number 42 then Save.

Now that looks better

Now let's set the search to auto refresh, click edit, click on the magnifying glass and then set auto refresh to 10min.

Let's create a Slack Alert:
Run the search again in the New Search window so we get the same result.
sourcetype=ethermine workers.rig03.worker=rig03 | table workers.rig03.hashrate | head 1
Now click Save As and select Alert
Give the Alert a title, set the time range to “Run on a Cron Schedule. I like a hashrate every 30 min so I use */30 * * * *
Set the trigger Conditions to trigger when the number of alerts is greater than 0.

Now select the Trigger Actions to be the Slack Webhook Alert you installed.

Use your Slack webhooks URL you got from Slack and then set the Slack message to something like: ETH Hashrate on Rig03 is: $result.workers.rig03.hashrate$
You can use the token $result.fieldname$ and replace fieldname with the hashrate field from your search results, in my case it is workers.rig03.hashrate and then Save.
For testing i would set the cron schedule to be 5 minutes so i can test the results, so have a play with the alert schedule and when you are satisfied with the alert you can set it back to your desired interval, 30 min to 1hr is good.
Homework Time! , Stop your miner gather some logs and work out how you would alert on the miner stopping?????
I hope this was somewhat helpful.
Have you done any work to look at your hash rates over time to identify issues with consistency.
I would definitely be careful about what companies you make API calls out to. This one seems all good, but cant say same for others.