BTC update
08/07/2019/09:00CET
Bitcoin is tightening into a wedge at the 11500 range. Will we break up or break down from here? Lets take a look at the charts and see what we can read in them...
BTCUSD Daily on Bitstamp
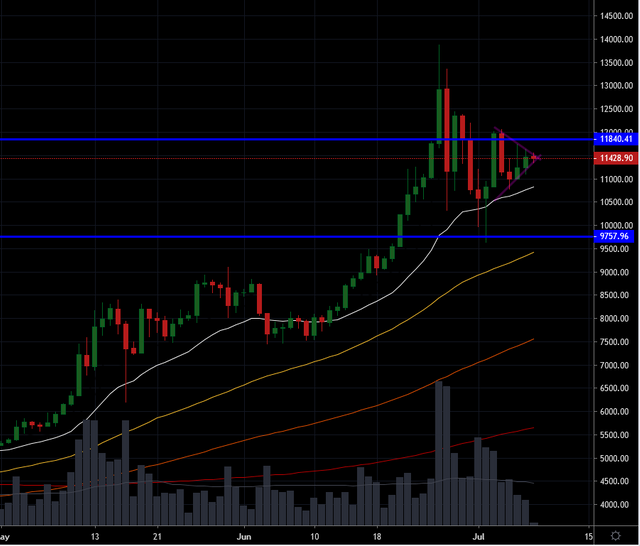
- Currently at 11428usd as of press time.
- We hit a low last week of sub 10k (9614) and we had a high of >12k (12061) just 2 days later. That's a 25% move in 2 days to the upside.
- Now we have settled into a tightening wedge with lower highs and higher lows pushing every narrower together.
You can see this very clearly in the volatility oscillator indicator here...
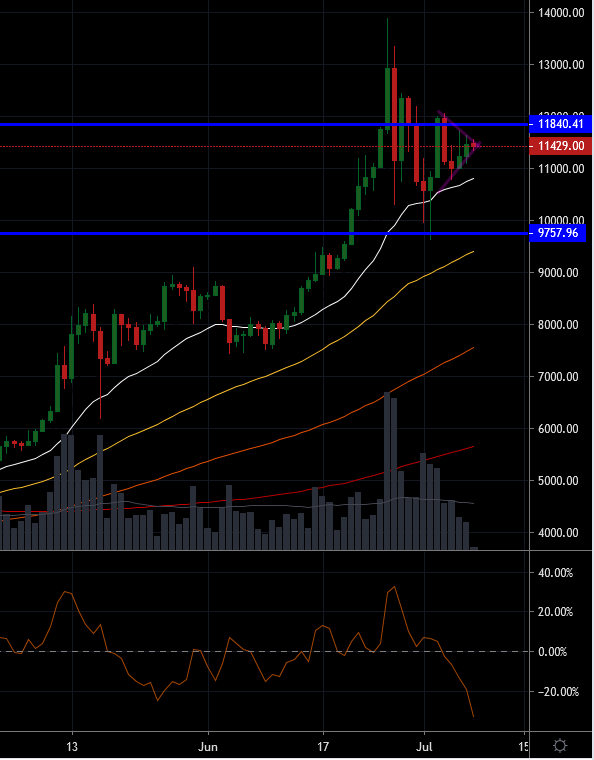
- Volumes as you would expect have also come down quite sharply.
- A look at long vs short positions on Bitfinex shows this...
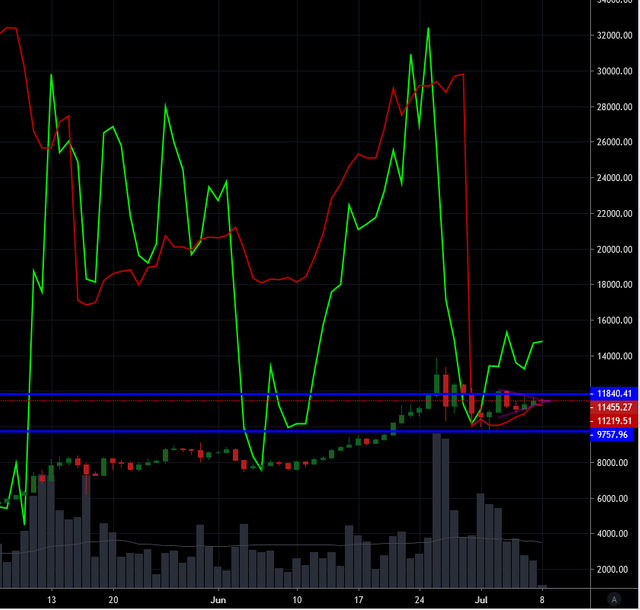
- (Green are longs and Red are shorts) There has been a sharp reduction in the short positions last week and they have remained subdued. The longs also dropped, not quite so precipitously as the shorts, but they are also showing signs of interest again.
- We could interpret this as a bias in the market toward higher price expectations from this indicator.
- But I think this indicator is far from the most important factors that will dictate which way the market will break, but this tightening wedge does portend an uptick in volatility soon.
BTCUSD Hourly on Bitstamp
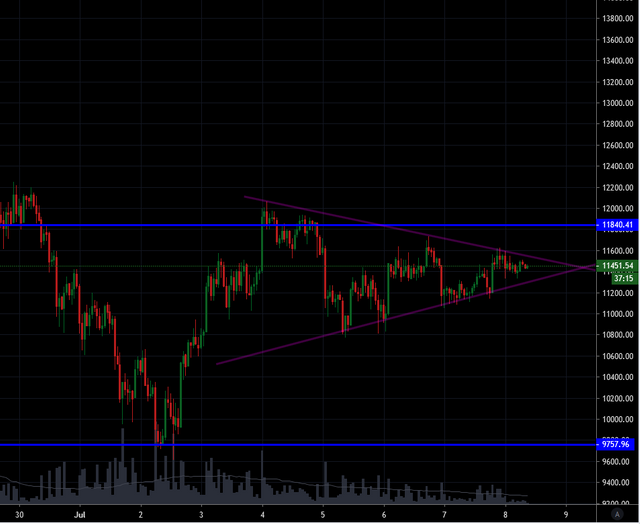
- Our wedge is more defined when looking at it in the hourly.
- Also the volumes receding is more clearly seen here. (Though we are looking only at one exchange: Bitstamp, the same kind of behaviour is seen on all large exchanges)
My take
We have had a 30% correction from the highs at 13760.
The correction was very short lived and if you did not already have your limit order in waiting for it, then you probably missed out.
There is still a lot of chatter on the crypto new cycle of a proper 40% correction for this most recent rally. Back on the daily chart, this is what it would look like:
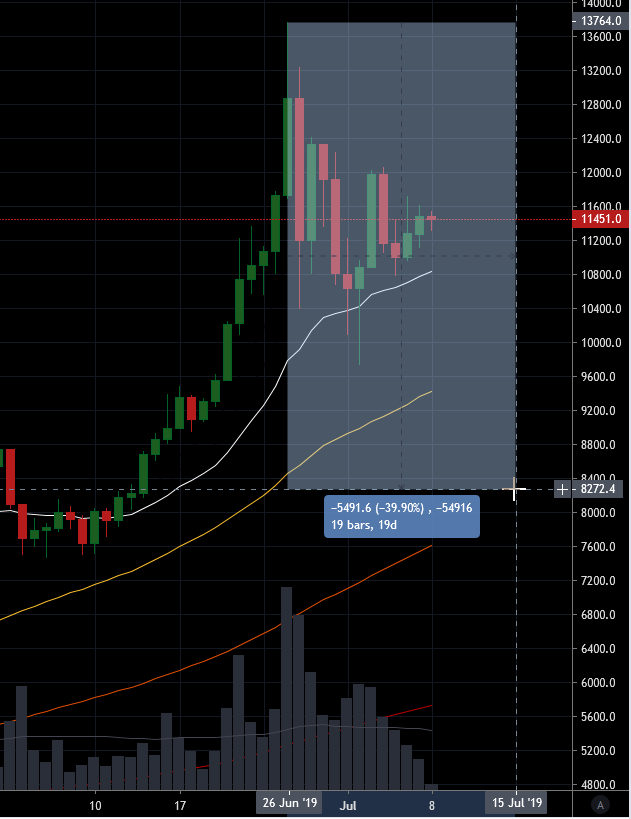
This would be a retest/revisit of 8270 levels. Our cognitive biases make this level sound very ugly, but remember we crossed this level in price only about 7 weeks ago in the middle of May and it was a level of resistance in the market then followed by tested support through into the start of June.
the 21DEMA and the 50SMA are in this zone sitting at 10840 and 9430 respectively.
While talking about moving averages, one of the ones that has tracked most bull outbreak retracements in bull market cycles of bitcoin is the 21_weekly_EMA. At press time this one sits at 7855.
I can see some significance historically of this level. It sits only $400 south of the 40% retracement. A drop to this level would end up being a 42% retracement from our local highs.
Again we find outselves on a knife edge of probabilities.
We can arguably find more indicators that suggest a move downward from here, but
If we add into it the geoeconomic conditions and fundamental analysis, a bias to a move higher appears.
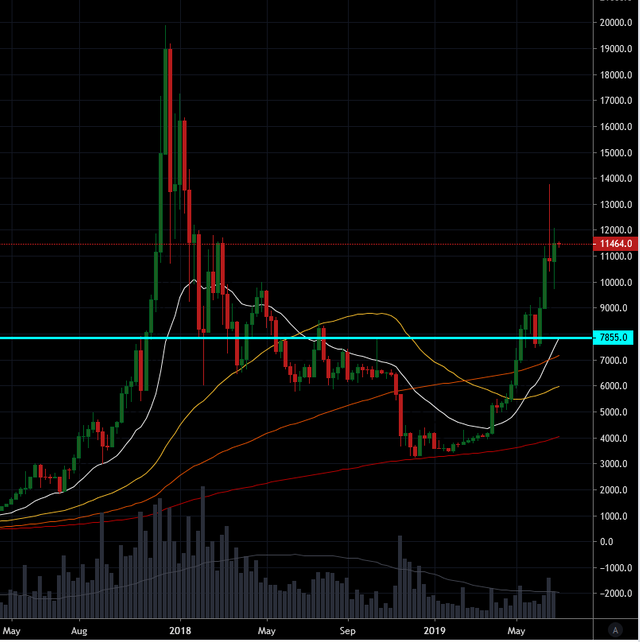
When we look at a market like Bitcoin at this granular level, we end up quickly stuck in the weeds not being able to look about at the longer term perspective. The weekly duration is very instructive here. (last chart)
Anyone who has studied the charts of bitcoin in any detail will know that the 6 years of stable data we have (lets forget MtGox for now) strongly suggest we are in a secular bull market. higher highs.
i.e. Bitcoin still has not found its far market value and is ascending toward it still. Within this are the typical cyclical patterns that all markets exhibit, which lend themselves to Technical analysis.
Put another way: technical analysis has a strong bias toward identification of cyclical patters in #bitcoin, while the secular nature of the market is better analysed by fundamental and societal analysis - far more subjective.
From a secular standpoint, one could argue:
- The current global financial architecture (GFA) is running into troubles and limitations.
- Troubles are arising from the increasingly desperate and hamfisted geopolitical policies from the US and its allies in using the GFA to maintain its preeminence. In particular against the triad of China/Russia/Iran, who themselves are showing signs of tighter cooperation.
- Limitations are arising from basic flaws in the GFA, namely fractional reserve banking and rehypothication of assets.
- On top of this is the increasingly obvious fact that lowering interest rates seem to no longer work as intended. Voluntary stimulation of an economy by incentivising borrowing (debt) with lower interest rates seems to be reaching its limits as the vast bulk of the economy is already at debt saturation.
- A ever greater share of the new credit creation incentivised by these low interest rates seems to be channeling more and more tightly into risk assets and stock buybacks, than the real economy.
- Thus the chronically low inflation which is lamented by the economic gods is not missing, It is simply all concentrated into risk assets.
- Strong indications are now visible that PMs, lead by gold, are breaking out of a cyclical bear market. Traditionally, gold is a safe haven asset which is normally bid in times of uncertainty. Though arguably, this has been less clear in the most recent few decades as the financialisation and rehypothication of the gold market has created a tail waging the dog case with cash settled futures opening the door to manipulation (naked short selling)
- The traditional banking system world wide seems to be entering a secular bear market. This is a very generalistic statement as I am sure there will be traditional players that buck this trend because they are nimble and open minded enough to adapt with the rapid evolution of their markets.
- Big Tech is entering the finance industry now. They will add a new dimension to what has been up until now a 2 horse race, i.e. big banks vs crypto is now big banks vs big tech vs crypto. It will be interesting to see the game that will play out between Facebook, and US regulators teaming up with Banks. The titans will fight it out! grab your popcorn.
- We have entered a phase of great capital reallocation. Contrarian investors should do well.
- The relative stability of the GFA of the past 50 years (~1971 till now) developed into a secular bear market of interest rates.
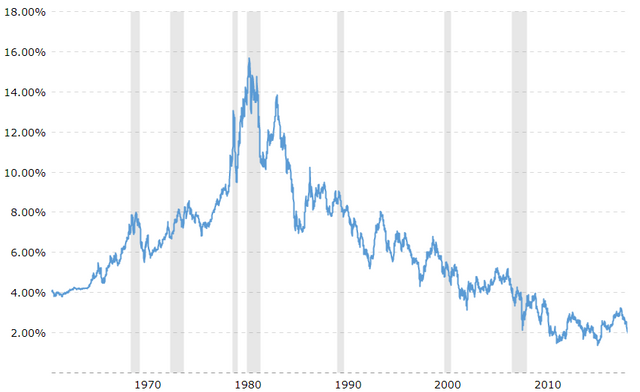 10yr US treasury rate. Source www.macrotrends.net
 - Globally there are over 14 trillion of bonds that trade a <0%. We are entering the twilight zone of economics.
- This is happening right at the time when our financial gods, desperate to keep the party going, can only go into negative interest rates and crazed money printing. For this they need a cashless society with them in control of all the levers behind it. And into this mix come the truly open cryptos in the background now securing their position as a viable safety valve, to compliment gold's historical role.
what a time to be alive!
As always guys, leave comments, have fun and trade safe.
Disclaimer: This post is not financial advice. Before investing any funds do your own research and make your own decisions. Cryptocurrencies are highly speculative.
And finally: Do not invest money you are not comfortable losing.
Help me to make more content like this.
Upvote me, comment and resteem.
Thanks

Amazing análisis as always my friend. The runup has been incredible and looks off in the charts, but I agree that btc can do whatever and blow our minds at any time. Cheers
Posted using Partiko Android
Good report.
Thanks guys,
As you may have seen it was right at the time of publishing this post, BTC broke out higher, its trading at the 11900 handle. A good 4% jump