BTC update
18/03/2019/08:30CET
#BTC is holding fast on our ascending trend line - does this portend a breakout? Lets take a look at the TA to get some feeling for this...
BTCUSD daily on Bitstamp
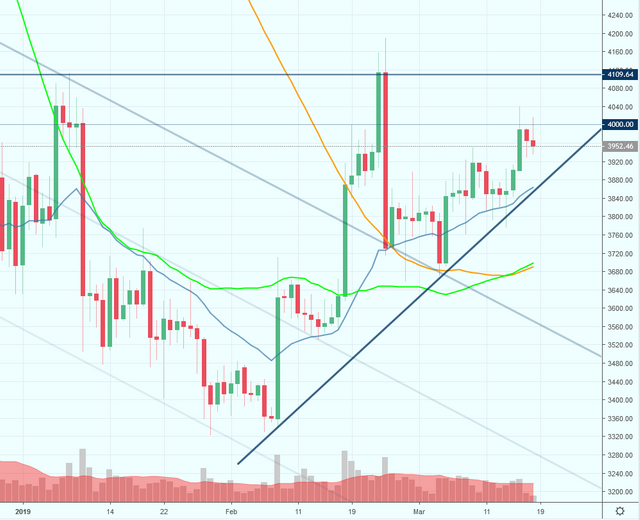
- We are trading at 3952usd at press time
- Our ascending trend line seems to be predicting the ongoing uptrend.
- We have challenged the resistance at the big even of 4k, but till now it has bested us.
- Over the weekend we have seen an uptick in volatility - first upwards quite sharply, then sideways with a downward bias.
- Volumes were higher on Saturday during the run up, but were quite low during the red day yesterday. Could this be a portent of buying pressure? (Volumes in Crypto markets are such a polluted indicator. Too easy to fudge and too many reasons to)
- I think the most important thing to see here is the holding of the ascending trend line. Always nice to see a TA indicator being respected.
- We are also staying on top of our 21dema indicator, along with the 50 and 100 sma indicators.
#Macro view
##BTCUSD weekly log on Bitstamp
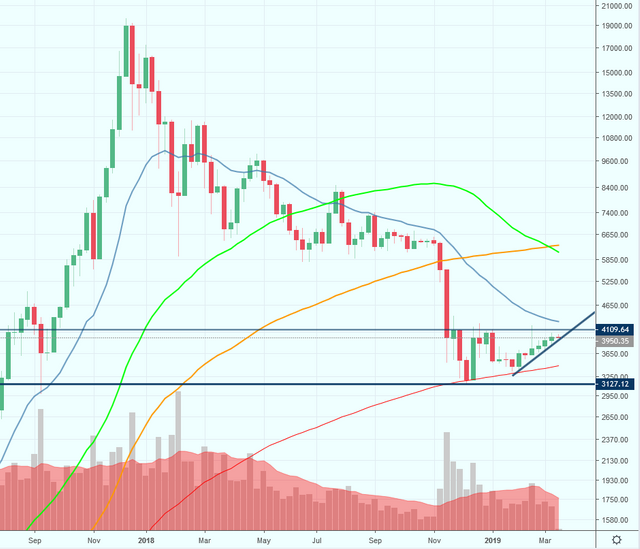
- Our long term log chart looks quite different than what we see when we study daily or hourly charts. So much noise covering up the macro trends.
- We have had a 7 week run following this macro ascending trendline.
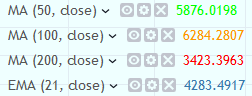
- The 200 week simple moving average has acted as support as many of us TA guys had predicted. It sits at 3423usd as of press time.
- The 21 week exponetial moving average is still above us at 4280usd. In 2 weeks it will stand at the lower 4200's. In the resistance zone of the 4110usd level that is visible in the daily chart.
Prognosis
Toward the end of the first week of April, our ascending trend line meets the next major resistance at 4110usd. I do not really see 4k as being the main hurdle in front of us. So expect some volatility as we negotiate the 4110 hurdle. It could push us back down, in which case I would look at the 3850 range as near term support. Or worst case, down to our long term 200 weekly moving average at 3420usd.
Conversely if we get out on top of the 4110usd level, then there is not much in our way. 4600usd has some significance but not much. It is where we had a pause on our way down last November. Then there is clear sky above us till around the 5500 usd level, then on to the 6200usd where we lingered for the longest time last year.
If we get to that level then we are on top of all our long term weekly moving averages.
I am not doing any crazy complex TA here guys, that means there is a whole raft of people like me coming to similar conclusions. There are a lot of eyes on #bitcoin at the moment because of what I have shared with you here today. There is only a thin ceiling above us standing in the way till 6200 levels. This is what swing traders are looking for. A position now at 3950, that would be a +50% gain at 6200! Upside to Downside risks are increasingly favouring a swing trade here. A position at 3950 could be backstopped with a sell at 3500usd so risk to reward is -11% vs +50%
As always guys, leave comments, have fun and trade safe.
Disclaimer: This post is not financial advice. Before investing any funds do your own research and make your own decisions. Cryptocurrencies are highly speculative.
And finally: Do not invest money you are not comfortable losing.
Help me to make more content like this.
Upvote me, comment and resteem.
Thanks