#2 - How to Analyze Cryptocurrency Charts
Hello My Friends,
Are you good?
Please Check "#1 - How to Analyze Cryptocurrency Charts" before Reading this post.

I hope You Installed Elwave and Meta Trader.
After creating an account on Meta Trader section of btc-e.com,
you need to login to your account from Meta Trader Application.
NOTE: You must download btc-e version of Meta Trader, as I said in the last post.
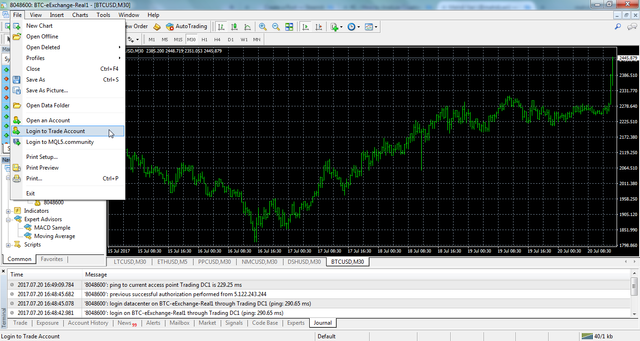
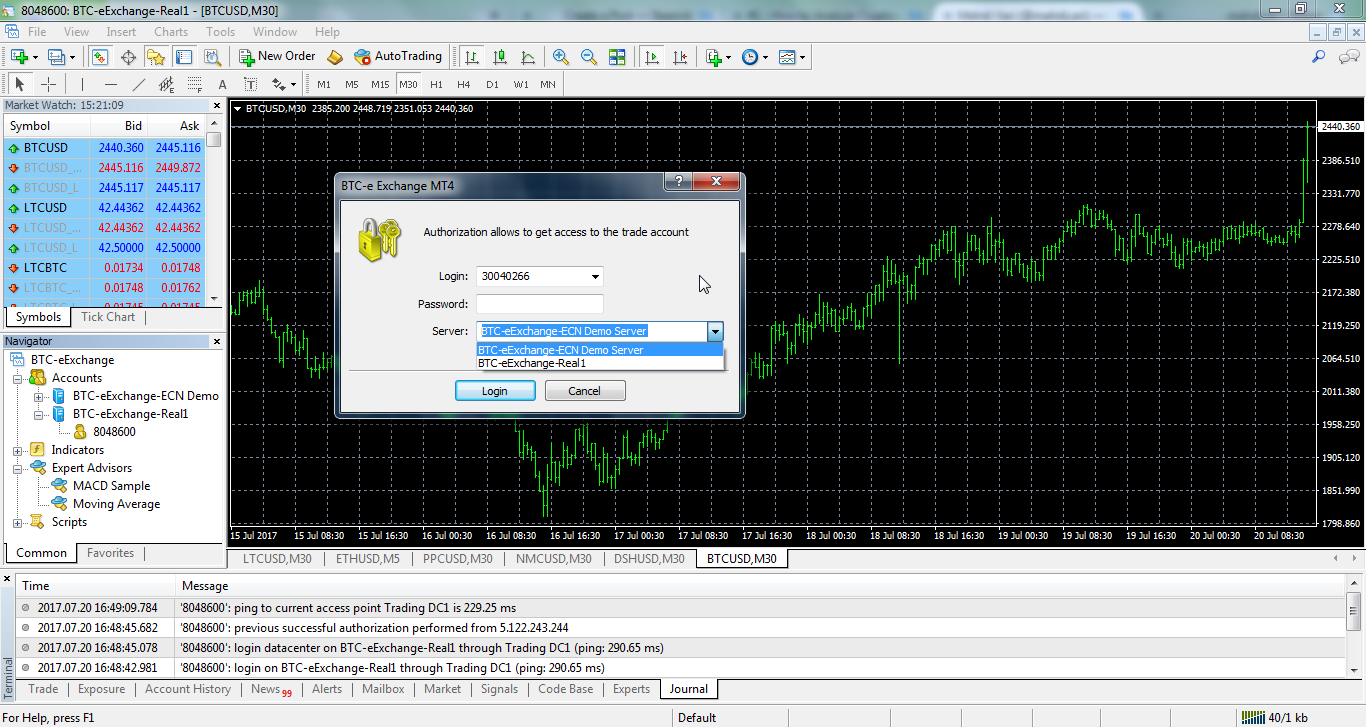
Click on File > "Login to Trade Account",
then select login server, it depends on your account type, Real or Demo.
and enter your login id and password of your account.
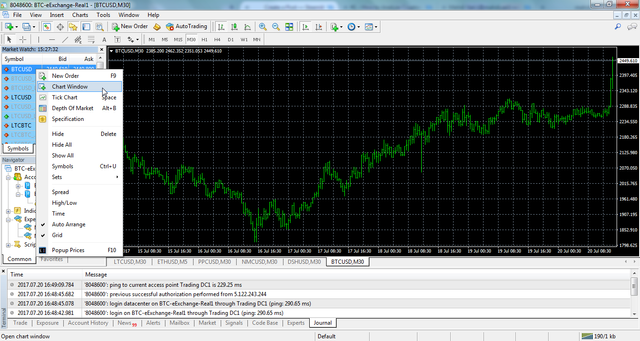
After Successful Login, You will be able to see Cryptocurrency Charts. Just Right Click on Your Currencies From Left Menu and Select "Chart Window".
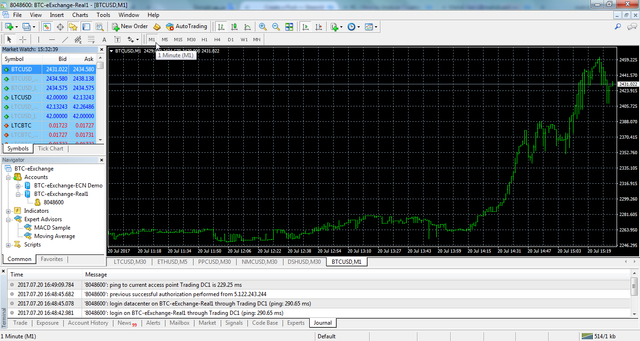
You can Explore Charts by Different Time Frames, Just Click on your FavoriteTime Frame From Top of Each Chart.
For Example, These are Monthly and 1 Minute Charts.

Now You must Save Charts that You Want to Analyse by Elliott Waves.
First, Select Your FavoriteTime Frame,
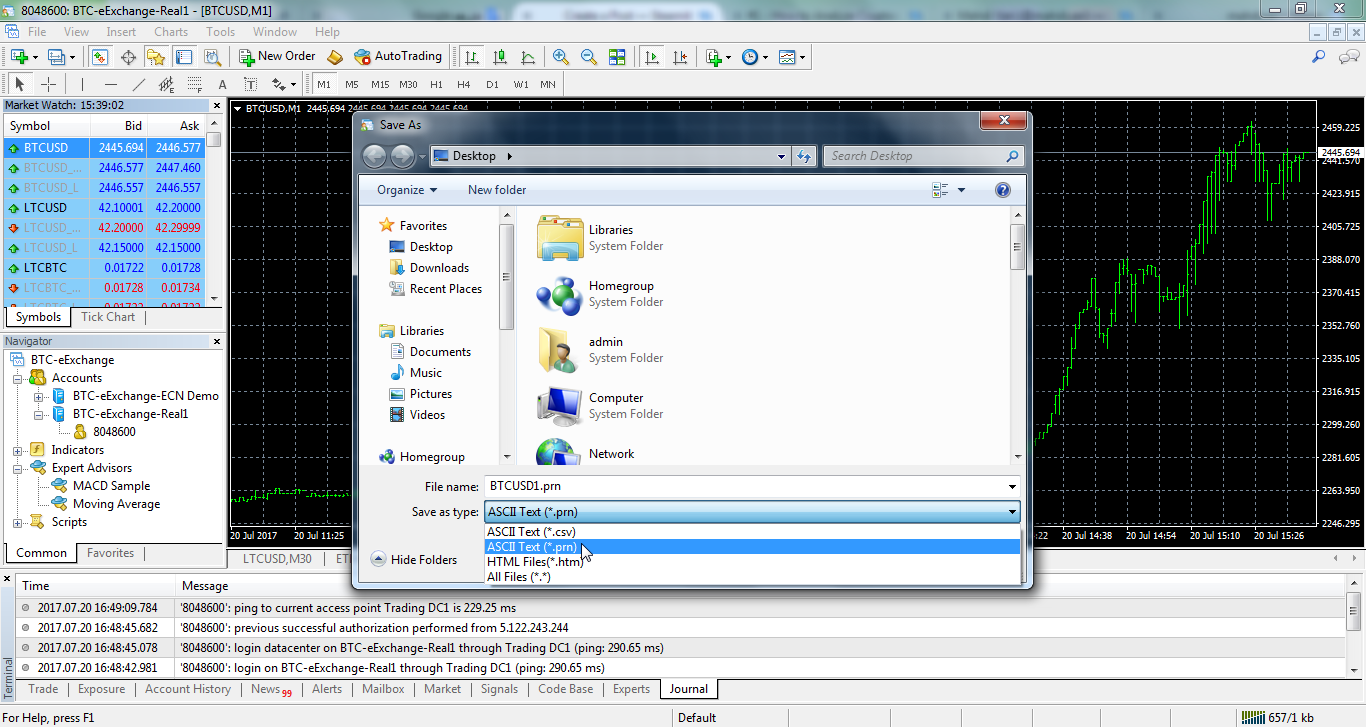
Then Click on File > Save as, or Simply Press "Ctrl + S"
Remember to Save Chart on Your Desktop with .prn Format, It is Important.
For Example, I want to Save 1 Minute Chart.
Analysing Charts
You can check my Last Posts about Forecasting Bitcoin Price, I Analyze Charts by this way, So if you want to be successful Trader or Analyzer, You must Think Deeper on Charts Analysed by ELWAVE and Elliott Waves. Also, You need Something else For Succeed, Experience.
Experience is More Important Than Analysing. Enter to the market with small amounts, Like $50. Deposit Money to your account and start Analysing. But, Don't Trade! You must be able to Control Yourself. You need to Watch market for about 1 Month, or at least 10 days. Controlling Yourself is Important Factor. After that, Start Trading with small amounts.
If you want to be Professional Trader, You must Wait. Sometimes Waiting Can change your life. You must understand better time to enter and exit.
Did you lose money? No problem, try better in the next time. You must Learn By Each Sell and Buy.
Anyway, Let's Talk about ELWAVE.
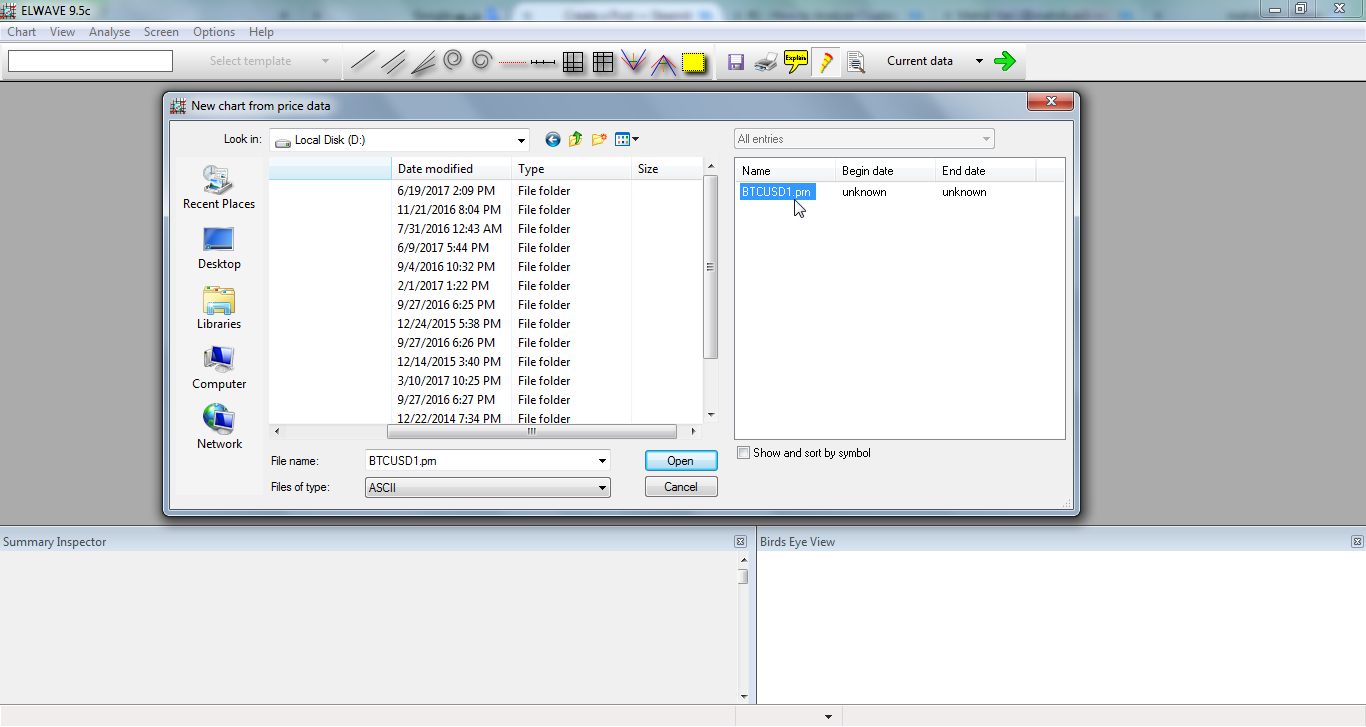
It is Elwave 9.5c,

Click on Chart > New Chart... ,
Go to Desktop, and Select Your Saved Chart From Right Section.
Make Sure "Files of Type" is ASCII.
Now You must See another window.
Please Change options like below. It is Important.
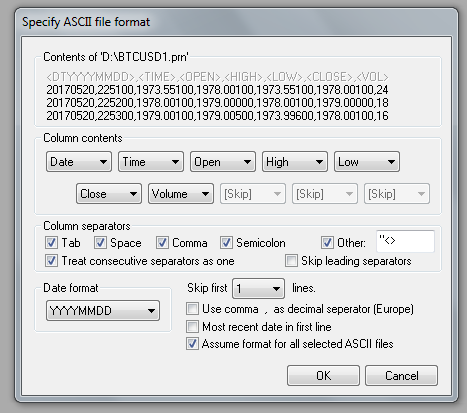
Then Click on "OK", If you get any error, check image above again.
Now Chart will be analyzed automatically. if it not happened, Click on Analyse > "Analyse entire chart".
It might take about 1-2 minute, depends on your system performance.
After 2 minutes you will see something like this:
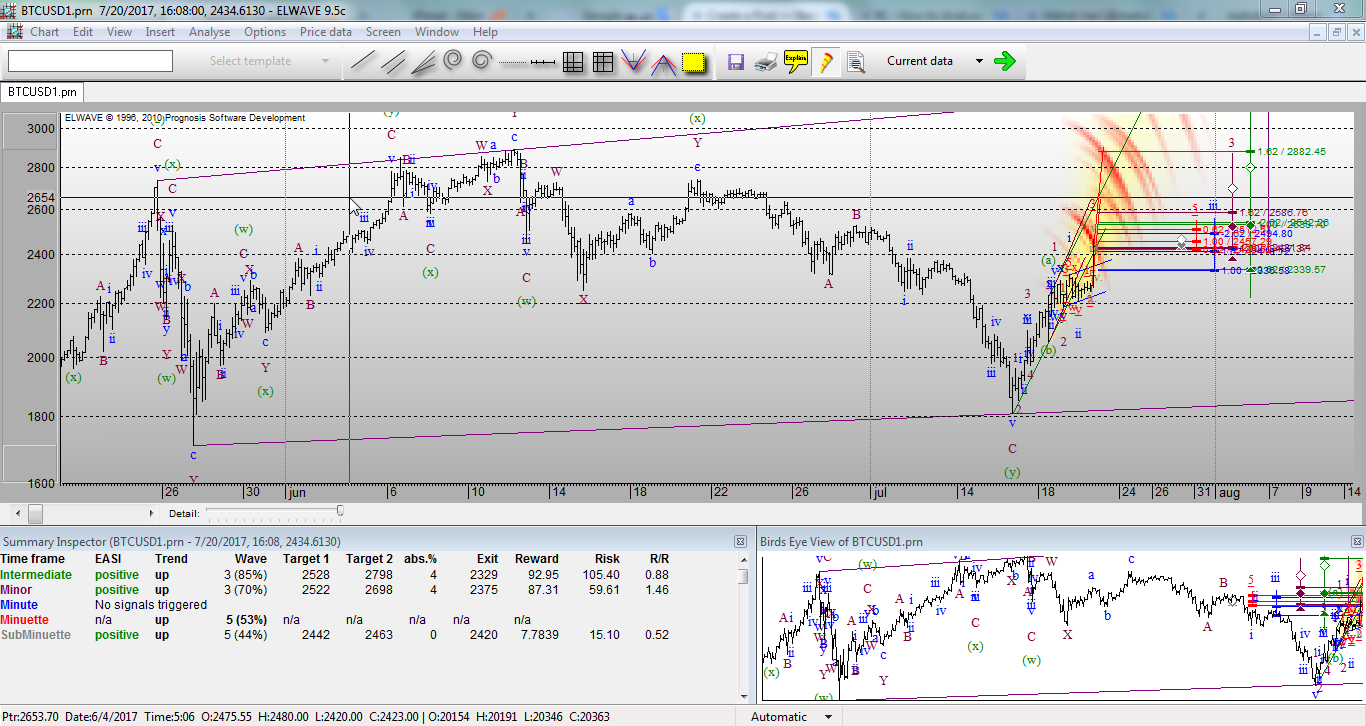
at the bottom of the page is some important information about the Analyzed chart, Let me explain.
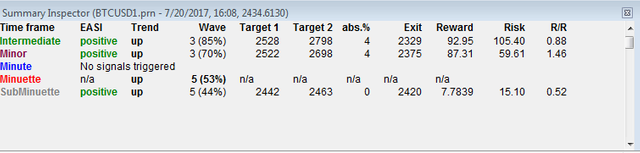
Time frame
in this section you will see different time frames, in this Case, "Intermediate" Is Longer than "Minor" and it is Longer than "Minute" and it is Longer than "Minuette" and it is Longer than "SubMinuette". in this chart Shortest term is "SubMinuette".
There is not exact period for this terms, but I can say Minor and Minute are Daily Terms.
EASI and Trend
in these sections you will see the market forecast. Don't Trust these Sections.
Wave
It is number or name of Waves, For example, "3" is Strong Wave.
Target 1 & 2
in Short: if Price reaches Target 1 it will Reach Target 2. Don't trust to this section too.
Exit
If coin reaches this price, you must stop your trading. in short: it is stop lose.
Reward
If you Buy(sell) on the first target and Sell(buy) on the Second target It will be your Profit.
Risk
If you Buy(sell) on the first target and Sell(buy) on the Exit It will be your Lose amount.
R/R
It is Reward/Risk, the Good amount for R/R is between 1 and 8, Don't trust to R/R Greater than 8 and Lower than 1.
Some NOTE:
Don't Use only One chart for analyzing, Use 1 Minute, 30 Minute, 1 Hour Charts too. You can Analyze Daily and Weekly Charts Too.
You can Enter to the market if all of the EASIs are Positive or Negative. What did I say? ALL of the trends in the All charts.
Only Use small amount of your money for trading.
It Was Not All Ability of ELWAVE Please be patient, You will learn more in next posts.
First image source: www.investopedia.com

Regards,
2017-07-20
This good info here I'm sure this would be helpful for newbies. Well done.
THanks for the tips
i m a forex trader with instatforex.com
this may help me a lot
:)
I'm Glad It was helpful :)
yes sure
i test you upvoter bot
great work to:)
Always something super helpful to learn on here! Thank you for sharing!
thanks for the tips!
thank you a lot for this post ...
@aravindgre
😋
I enjoyed this post
Very great post
I got some benefits
Nice post
You are upvoted by me and I'm following you.
Please visit my blog and upvote and follow me.
I will do the same for your each vote.thanx
Thank you very much for this information
Congratulations @mahdiyari! You have completed some achievement on Steemit and have been rewarded with new badge(s) :
Click on any badge to view your own Board of Honor on SteemitBoard.
For more information about SteemitBoard, click here
If you no longer want to receive notifications, reply to this comment with the word
STOP