The Crypto Dip - Was the 2018 Dip Predictable Based on Past Patterns?
Anyone invested in cryptocurrency has gone through a rollercoaster of emotions this past month:
I'm hearing a lot of speculation that this was predictable, that the market dips every year around this time in January. Therefore if we want a sneak peak of what's to come we can review last year's charts and simply presume its behavior.
But are the patterns comparable enough to make any sort of deduction? Let's review...
Shown below are two charts of the cryptocurrency total market capitalization in the month of January with Figure A representing 2017 and Figure B representing 2018:

(Figure 1)
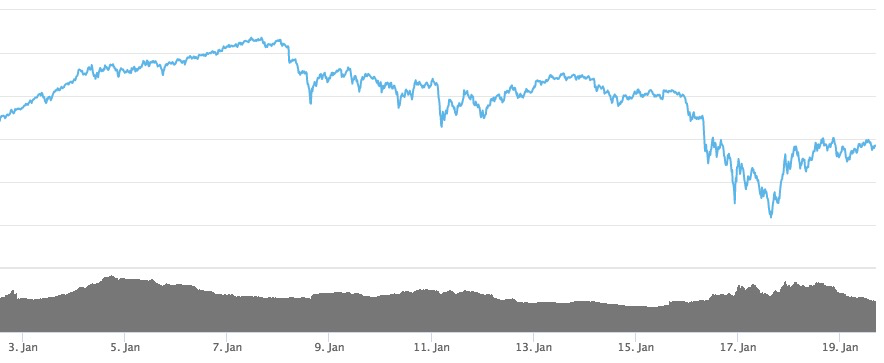
(Figure 2)
Although not visually identical, it's clear the two charts share a lot of similar traits. They rise to a peak, drop down a bit, go up a bit, more or less level off, take a huge dip, then start to creep up again. The highlights themselves happen very close to each other with the major peaks separated by two days and the major dips separated by five.
Some are chalking this up to various annual events that involve large waves of monetary motion such as Christmas and the Lunar New Year. This makes sense, I wouldn't deny that said events can have a huge impact on market fluctuation.
With that in mind, however, I am not convinced that the similarities coinciding between this year's chart and last year's are indicative of what's to come. I'm not saying the market won't rebound and continue to rise to all time highs. In fact, I hope and believe it will. I just wouldn't promote false hope and comfort by saying "Hey, same thing happened a year ago" and here's why:
Let's break down the numbers. January 2017's peak hit around 22 billion:

(Figure 1.1)
Then bottomed out around 14.4 billion:

(Figure 1.2)
Giving a total drop of give or take 7.6 billion
Now let's look at our recent crater. January 2018's peak hit around 834 billion:

(Figure 2.1)
Then tanked down to 417.6 billion:

(Figure 2.2)
Giving us a whopping 416 billion dollar plummet and, no, I didn't forget the decimal because who cares?
To further put this into perspective see Figure 3 demonstrating the reality of how January 2017 really measures up to January 2018:

(Figure 3)
It's incomparable, as if we were to liken a sneeze to a tornado. It takes a lot of momentum to move that much money and there were some big wheels in motion that weren't in the picture in 2017. What were these factors? That's another article. But the two time frames shown in context alone is enough for me to blow off any argument emphasizing homogenous patterns.
Could 2018 be a repeat of last year at an exponentially higher rate? Possibly, I have no evidence to argue against it. But if you ask me at this point in time come early January 2019 will I be selling? All I can say is, "I wouldn't bet on it".
Congratulations @lordpalmerston! You received a personal award!
Happy Birthday! - You are on the Steem blockchain for 1 year!
Click here to view your Board
Congratulations @lordpalmerston! You received a personal award!
You can view your badges on your Steem Board and compare to others on the Steem Ranking
Vote for @Steemitboard as a witness to get one more award and increased upvotes!