Trading made Simple #1 - Bollinger Bands

One tool with trend and volatility that is super ease to read

- Upper Line - it's a deviation above the moving average
- Lower Line - it's a deviation below the moving average
Simple right? It's like having 2 tools in 1
I find Bollinger Bands very useful in a market that have high volatility (cryptos). It's one of my favorite tools that I use to determine price movements that are sometimes hard to spot.
Let's talk about signals! How to use them and apply them to our trades?
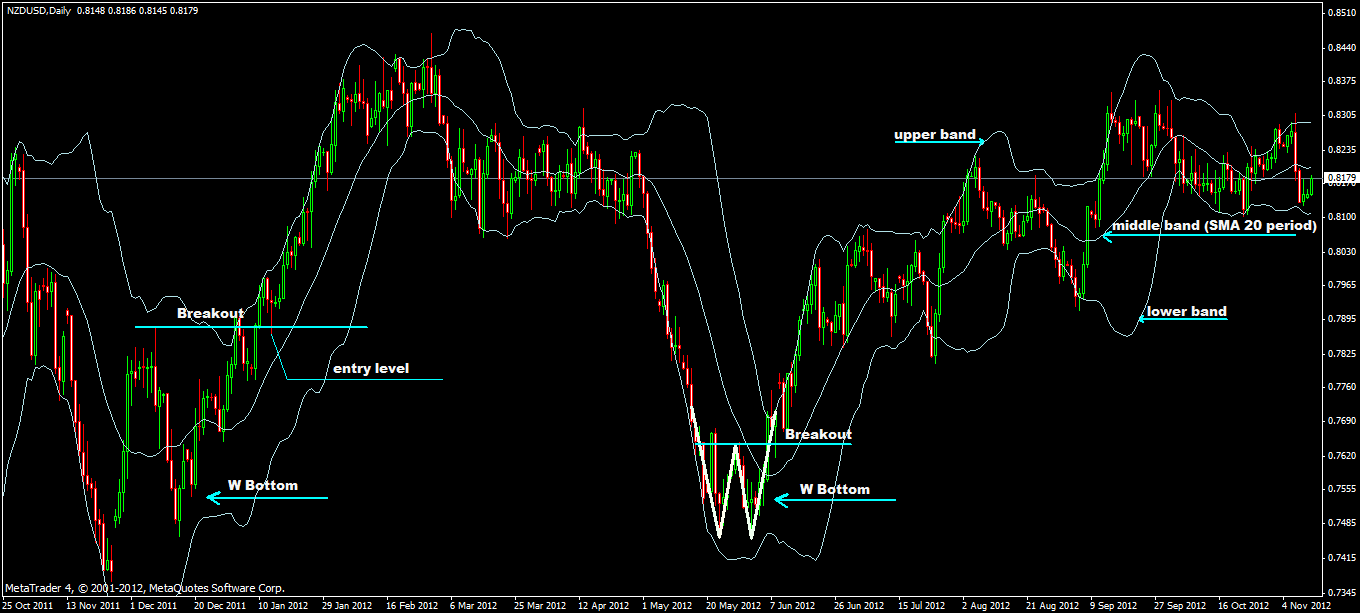
Bollinger Bands are used to show contracting market, that's when you can anticipate big price breakouts.
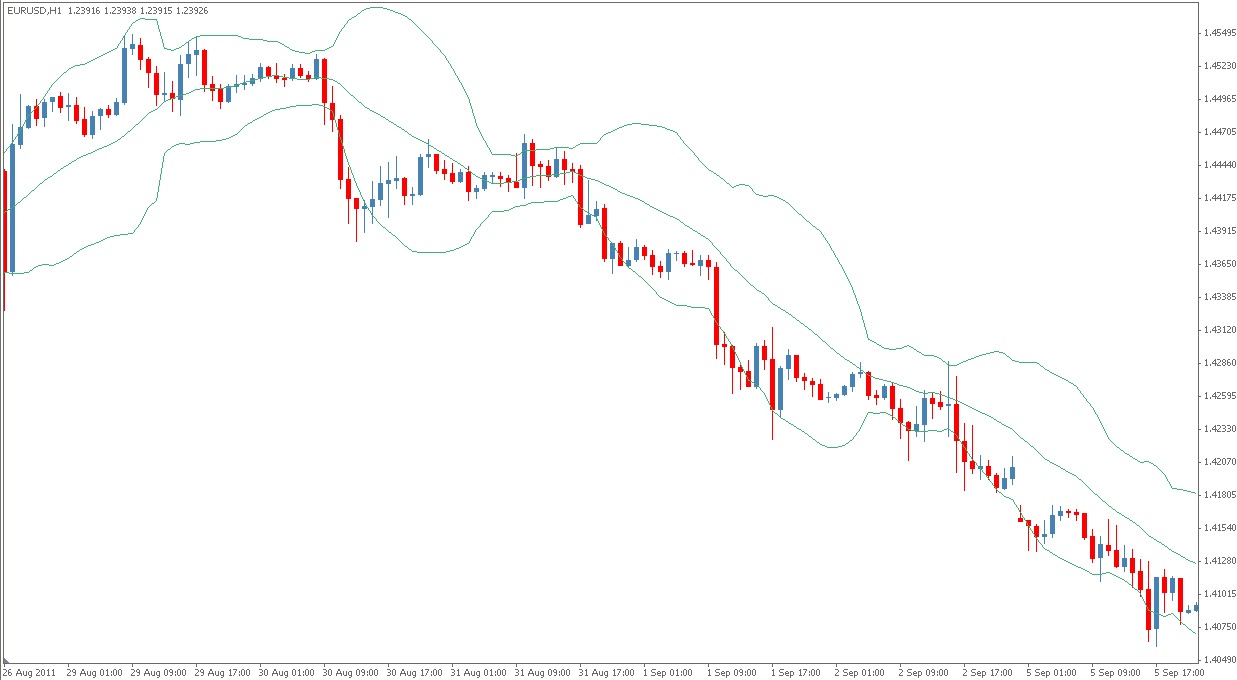
So let's take a look at one very important signal when both Bands are kinda squeezing the price bars...

That is a signal of low volatility, after we are looking at the breakout of the narrow range of trading...( thats when usually shit hits the fan and it can go both ways)
When we see large moves in price and time in a direction of trend, theses trends are called Impulsive Moves. Now when the market makes smaller moves against the trend, theses are called corrective moves. So Bollinger Bands are giving us ways to measure corrective and impulsive waves...and again it's 2 in 1...preety cool right?
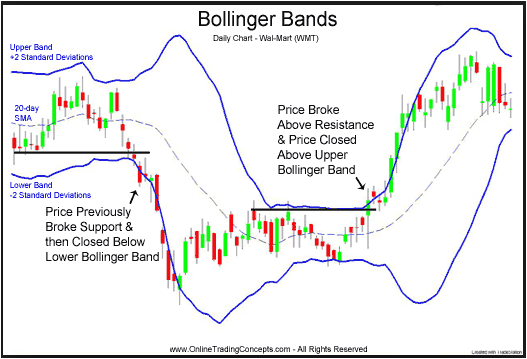
Let's take a look at Impulsive moves. Impulsive moves happens when price bars move far enough to reach the upper or lower lines, it's evidence of strength in that direction and tells us that trend may be starting. On the other hand Corrective wave moves against the trend after that retraces back to the moving average, but shouldn't move to the point when it touches the opposite line.

Let me know if you find this post useful.
Follow me here to stay updated.
Happy Trading !!!
Enjoyed the post, good info.
Really good content thanks https://9blz.com/bollinger-bands-indicator-explained/