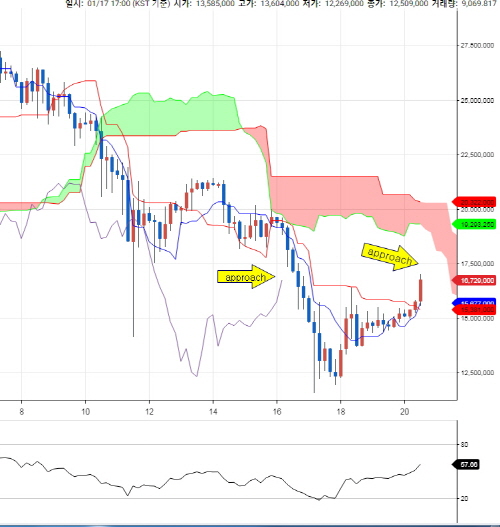
Bitcoin Ichimoku chart reading real time
.jpg)
This is Bitcoin 4hr Ichimoku chart.
Look at the yellow arrows.
Left line is chikou span. It is approaching 26 candle before price.
Right arrow shows that present price approaching the kumo(cloud).
It means the price will meet a resistance.
It will bounce down or penetrate a resistance and goes up.
Anyway, there will be a big movement in several hours.
Watch it.