Ethereum (ETH/USD): Ready To Breakout?
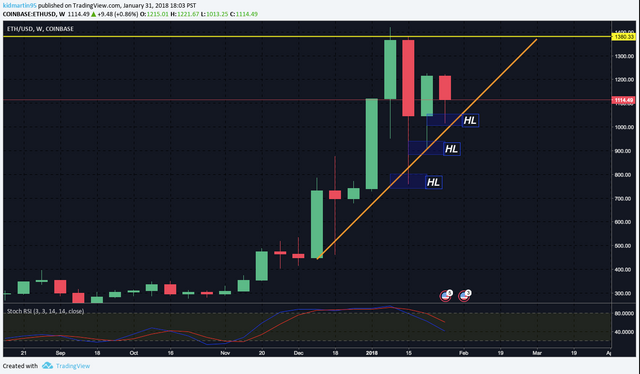
Weekly: Showing Higher Lows being formed (highlighted in Blue). Respecting our uptrend, expecting consolidation between $1,000- $1,200. A break and close on the Weekly timeframe(tf) (1 weekly candle) below $1,000 or above $1,200 and a breakout will occurred.
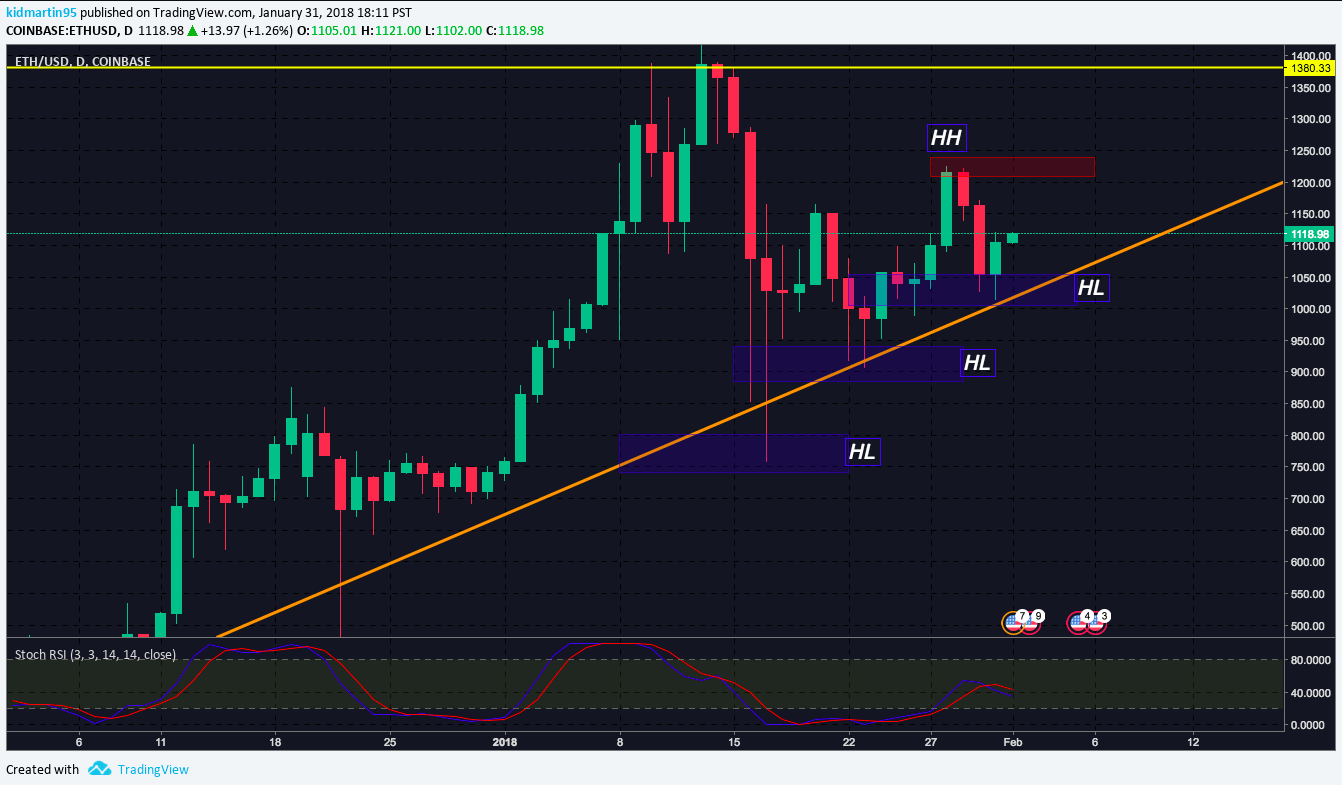
Daily: Higher High is visible (highlighted in red) on Daily timeframe(tf). A break and close above ($1,200 *red zone) and expect another Bull Run. A break and close below the ($1025 *blue zone) and things could get ugly.
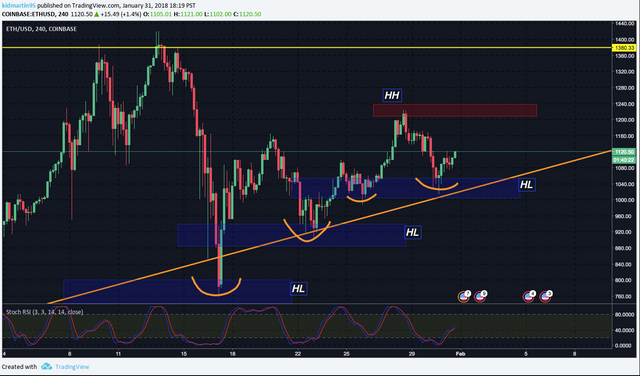
4 Hour: Shows an Inverse Head & Shoulders + fake breakout to come back down and test for support (yellow marks). Expecting a run up to $1,250 followed by consolidation.
In conclusion Ethereum is looking to breakout towards the upside. Support has been found @ $1,000 with a double bottom (yellow marks). Happy Trading! :)
Thank You for Your Support! Check out the links below :) Subscribe and Turn On Post Notifications New Video Everyday!!!
DTube:
Be the first in line to use Robinhood’s Zero Fee Trading: http://share.robinhood.com/martinc13
Social Media:
Twitter: https://twitter.com/KidMartin95
Instagram: https://www.instagram.com/kidmartin95...
InvestFeed: https://www.investfeed.com/kidmartin9...