Quantitative Crypto Investing(7) - Creating a Trading Strategy with a CAGR of 52% and MDD of 6.7%
Hi fans! Well, there aren’t that many, but still… I will continue that story anyway until the count reaches 100 or more!
So far, we have learned the following lessons:
1. It pays to invest in rising markets
2. Volatility Targeting works wonders in reducing your drawdowns
3. Investing in Multiple coins reduced volatility and drawdowns as well
Now, finally, let’s combine this into an investable strategy.
The backtest I am going to show you was done with 4 coins – Bitcoin, Ripple, Dash, Lightcoin.
Why did I choose these coins? Well, these coins were existent in 2014. This is very important because crypto had a huge bear market back in 2014 and 2015. A backtest, obviously, should include bear markets where making money is pretty difficult. If your backtest only included 2017, your result would be pretty good, but it won’t have much meaning as every strategy made money during 2017 as virtually every coin went up twentyfold or more. Ethereum might be the coin with the second largest market cap now, but it was nonexistent in 2014.
I. Strategy: 3,5,10,20 Moving Average + Volatility Control
1.Choose coins of your choice(I recommend to choose at least 3)
- Used in the backtest: Bitcoin, Ripple, Lightcoin, Dash(as discussed above)
- You, obviously can choose other coins, and choose more or less than 4 coins if you so desire. I advise you to choose the most liquid coins available.
2.Backtest Period: 2014.2-2018.1
3.Transaction Costs (Fees + Slippage) : 0.2% per Trade
- There are exchanges where you might pay less, but I chose a fairly conservative number.
4.Investment Strategy:
- Check the 3,5,10,20 Days Moving average of each coin once a day
- If the price of a coin is higher than ALL these averages, you invest in that coin, otherwise not.
- Bet size: 2%/ (Volatility of the coin to be invested/Number of coins in your universe)
- Volatility Calculation: Average of the 1-day volatilities of the last 5 days
- 1 Day Volatility: (High-Low)/Open
- You sell if your coin is no longer above all the 4 averages
This strategy both utilizes the Moving Average (An Indicator separating rising and falling markets) and volatility control I have explained in prior articles. You can look up here:
https://busy.org/@kangcfa/quantitative-crypto-investing-4-risk-management-or-how-your-losses-never-exceed-20-of-your-equity-part-2
How to calculate volatilities.
I think targeting the volatility at 2% is a pretty decent idea. Let’s say that you want to invest in 5 coins. In a specific day, let’s say that Bitcoin and Ethereum has a price higher than their 3,5,10 and 20 days moving averages. The other 3 coins fail that test. Let’s also say that Bitcoin has a volatility of 8%, while Ethereum has a volatility of 12%.
Then, you might think of investing 2/8 = 25% in Bitcoin and 2/12 = 16.66% in Ethereum, but this is too reckless in my opinion. You should divide the number by 5 – The number of coins in your investment universe. So, in this day, you invest 25%/5 = 5% in Bitcoin and 16.66%/5 = 3.33% in Ethereum.
You can see that you increase your bet size if
1. The volatilities of the coins are reduced
2. If more coins have prices above their four averages
Why did I choose to invest only if the price is above 4(!) averages? Well, that happens not that often, but indicates a pretty strongly rising market. If your price exceed not only 1, but more moving averages, the probability of the price rising further increases a bit.
II. The Result
Now the big question! What would have happened if you had invested this way? You might believe the bet sizes were just too tiny and the strategy was just too timid. Well, let’s find it out.
<4 Coins, Investing when price exceeds the 3,5,10,20 days moving averages, volatility targeting at 2%>
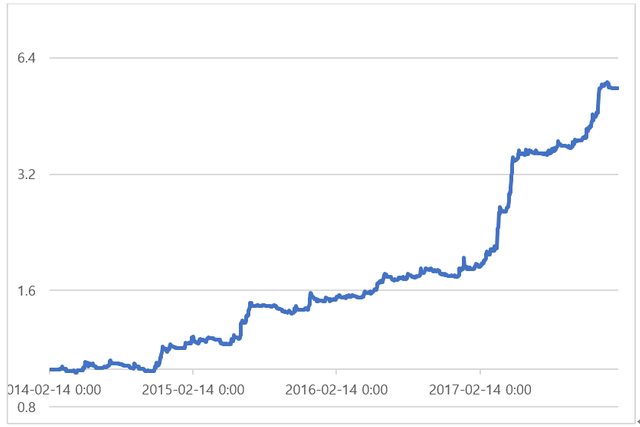
This strategy had a CAGR of 52.05% and a MDD of 6.73%!!
Investing only in days where the price exceeds four moving averages was pretty brilliant. The winning ratio was 54.33%, and the profit-loss ratio was 1.74.
There were 33 occasions where you lost more than 1% in a single day.
Is that not pretty astonishing? In the volatile coin market, your biggest loss on your equity was just 6.73%!! While earning an investment return of more than 50% per year, compounded!!
I told you that combining moving averages, volatility control and multiple coins can work wonders for your portfolio.
Astonished by that strategy? It gets far better. In a scale of 100 points, I would give that strategy 60 Points. I know strategies worth at least 90 Points. These I will describe in due course.
Keyword: Volatility Breakout, Seasonality!
But before that, in my next article, I will explain the most important terminologies in coin trading in greater detail: MDD, winning ratio, profit-loss ratio and the like.
와우!! 힘내세요!!
Coins mentioned in post:
Thank you for those great insights. You did your backtests with Python? Maybe you could provide the code?
And in your strategy, what is in the next day if the buying rules are still positive? Are you buying more of the assets from yesterday? Or just hold until the selling signal is coming?