BTC Technical Analysis Update 31/10/2018
Evening all, i will be providing some of my thoughts with the current BTC market.
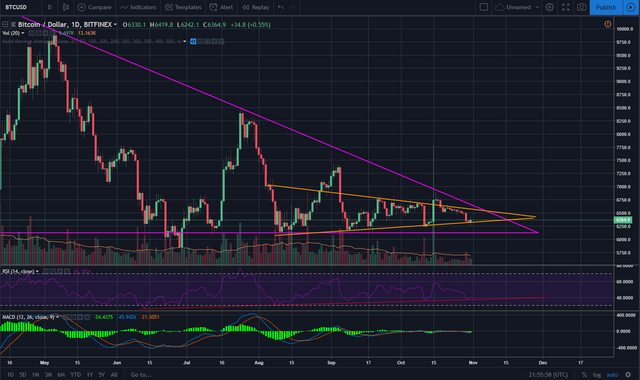
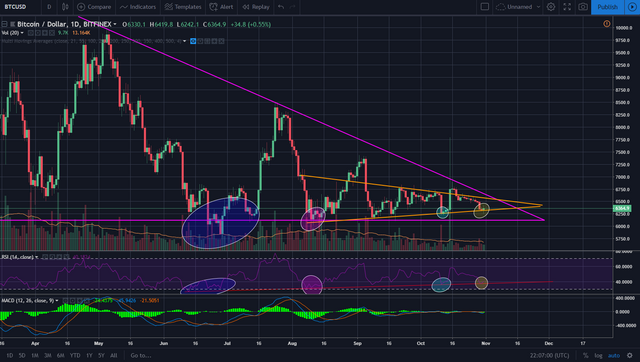
First of all i want to talk about the technical pattern is following which is the symmetrical triangle. Something interesting is the fact that BTC has held on this lower support of the triangle, the reason this is intriguing to me is because for one, it still means we have maintained a series of higher lows since the July drop, as well as this, if we manage to hold this level and then have some upwards price action, we could be testing the resistance of the descending triangle, potential breakout? my guess is no, but something to watch for.
Next id like to take note of the RSI which has been making a series of higher lows which coincides with the price action on BTC. Ive marked out the series of higher lows which matches up with the price action, if the red support line of the RSI holds out, we could definitely see a retest of the resistance on both the symmetrical and descending triangle. Something else to also not miss on the RSI is the lower highs we have also seen since the end of july.

Symmetrical pattern in BTC price action as well as the RSI, as we know, the symmetrical triangle is a continuation pattern, and considering BTC is in a medium term bear market, maybe implying a continuation of downwards price action.
==============================================================
Disclaimer: I am not a financial advisor and any of my content should not be taken as financial advice. The information and content provided is purely my own thoughts and intended for informational and entertainment purposes only. This is not investment advice. If you want to invest you should consider consulting with a professional beforehand.