[Edited] Using Python, Seaborn and Quandl to understand correlation in price and return among different crypto-currencies [WITH CODE!]
Ok, so recently I been talking to some of my friends who are active in crypto-currency trading. They held different opinions which I think are both legit.
<The conversation>
My Friend Watson: I observe that when BTC drops, all other coins will drop at the same pace. They are moving together just like stocks in particular industry. If banking industry is weak, JP Morgan and Goldman Sachs will be bearish together.
ME: Ok I totally agree.
My Friend John: But Let's not forget about the recent rally in ETH, when ETH reaches $400, BTC drops like hell. I think they are still independent in some ways.
ME: Shit, what do I do now?
<End of the conversation>
Ok, my first thought is that I am with Watson. After all, all coins are going up together in recent months. When I crawl different websites on Google, I dont really see any in-depth analysis about the correlation between different coins. As my followers request, here's one.
Analysis Using Python, Seaborn, Pyplot and Quandl
For coders / programmers: I will only mention the important part of code in this post. If you want to visit my code/github, You can check out my jupyter notebook here.
1. Library
import numpy as np
import pandas as pd
import seaborn as sns
import matplotlib.pyplot as plt
plt.style.use('ggplot')
import quandl
import re
API = 'your_key'
quandl.ApiConfig.api_key = API
2. Data I crawl
Data I crawl comes from Bitfinex, which is a trust-worthy exchange and data center. I use quandl to request therefore all the data is cross-validated.
I collect the daily mid-price of 6 different coins, including:
'ZECUSD': Privacy and partner with JPMorgan
'ETCUSD': I see a great potential in ETC when ETH fuck up in PoS
'BTCUSD': I will just leave this here
'LTCUSD': Technical improvements over Bitcoin
'ETHUSD': Coin with Meme war
'XMRUSD': Better coin for crime
The time series start from 2016-12-01 to 2017-06-15 for two reasons. 1) I can't really find data earlier that 2016-12-01 for all six coins. 2) Market structure changes tremendously in recent months. This time series already covered several market changes.
3. Correlation matrix based on price from 2016-12-01 to 2017-06-15
If the number close to 1, that means the pair has high correlation and moves together.

But my first comment is: Don't trust this. People often get too fuzzy right after plugging in the price and see expected outcome. Before making any conclusion, let do further analysis to validate our result.
A simple (But not entirely correct) rule of thumb: Positive price correlation means that the trend of different crypto-currency indeed moves together. The plot simply indicates that if the market is bullish, every single coin should be bullish. What the plot doesn't account for is a connection between days. That say, if bitcoin has a good intraday return, do other coin also yield a good intra-day return.
3. Data process in Log Return
I simply calculate the return of different currencies between everyday and the day after it. I will also take a natural logarithm for every return as sometimes the change in daily price can be dramatic and log comes to help and downscale the volatility.
If all of these sound complicated, just think this as an improved indicator of percentage change.
The code to plot the log return
log_df = pd.DataFrame()
for col in df.columns:
    temp = df[col]
    log_ = np.log(temp) - np.log(temp.shift(1))
    plt.plot(temp.index, log_, label=col)
    plt.legend(bbox_to_anchor=(1.05, 1), loc=2, borderaxespad=0.)
    log_df[col] = log_

plt.show()
You can see that the return (or percentage change) sometimes diverges

And Here's the correlation matrix of Log Return between different currency

First thing first, If Bitcoin yield a good return for 1 day, it shows literally nothing about Ethereum movement. 0.094 means that the relationship between BTC and ETH is nearly completely arbitrary.
Thats why the market sometimes has a huge debate about how BTC is related to ETH in terms of price movement. Because they don't.
[Bias comment] Personally I am much more convinced with this statement as ETH has a smart contract feature which is kind of targeting to replace Bitcoin in blockchain.
Here the temporal evidence is that:
- Both ETH and BTC are subjected to market sentiment. They do move together in trend.
- For short-term speculator, movement in BTC shows no indication of the movement in ETH.
But I still dont trust this result, we need more evidence
4. More Cross-validation in ETH/BTC
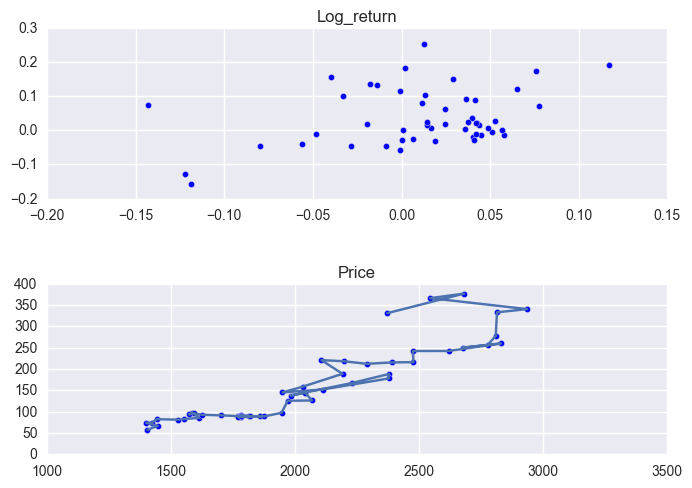
I want to clarify that this plot is not showing ETH/BTC, but with X-axis = BTC to USD, Y-axis = ETH to USD
This plot has two subplot. While the plot in the bottom is showing BTC price to ETH price, the plot in the upper is showing the log-return of the coins.

Complicated af, I know.
The orange bounding box is the time that these two coins is not really correlated. It's actually the time between 2016-12-01 to 2017-03-15. What's important here is that the market in that time is completely different from now.
So I remove the time and plot again. Here is the same information from time 2017-03-01 to 2017-06-15.
The point is more organized but the data-point is not very dense. Lets updated the correlation matrix.
5. Correlation matrix in Log Return between 2017-03-01 to 2017-06-15

Holy shit, ETH literally has total independency.
6. Correlation matrix in Log Return between 2017-05-15 to 2017-06-15

What I can say is that ETH, no matter in which timeframe, is really independent, while Bitcoin usually moves together with LTC. Correlation less than 0.6 can be inferred as a weak correlation. And movement in ETH isn't really connected with BTC.
One post isn't really enough for me to elaborate for other currencies. I would like to see if I can add part2, 3 in the future. Please follow and upvote if you want to keep track of my research. Thank you.
thank you, thank you and thank you.
I dont think i understand it all.. bult ill look into this again and do same calculations to try to grasp this.
thanks again for sharing, and trying to explain it!!
This is really informative
And I do want to learn python as well