Litecoin Price Analysis for 02/16: LTC/USDT to Remain Below $80, LTC/BTC Pushes for 0.007948 BTC
Yesterday was a very rough time for all cryptocurrency markets. The Litecoin price is moving up again, although there is still a dip to overcome.
Litecoin Price Momentum Wants to Reverse
Bitcoin has an unhealthy habit of dictating the pace for all markets. Yesterday's dip triggered steep losses for most markets, albeit there are some exceptions. The Litecoin price has not budged all that much, yet it is also rather slow to recover losses. On a Sunday, that isn't abnormal.
Although there is healthy trading volume, the market lacks a bit of ‘oomph’. With $1.943 billion in trades, there can still be ample Litecoin price volatility in the hours to come. Despite the dip, a push to $80 again and higher can materialize in very quick succession. The LTC/USDT markets will play a key role today, by the look of things.
LTC/USDT Technical Indicators
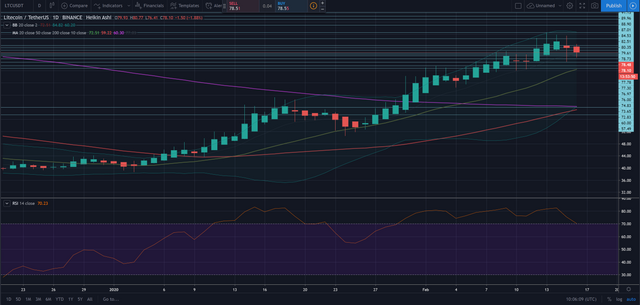
Bollinger Bands: There is ample liquidity and volatility for LTC/USDT, which explains the wide open Bollinger Bands. Although the bands have begun narrowing a bit, there is still no real "sideways trading" momentum to speak of on the daily chart. Overcoming today's red candle will be the first order of business.
Moving Averages: The moving averages for LTC/USDT are still bullish, all things considered. The MA20 continues to move higher, as does the MA50. Speaking of which, the MA50 may perform a bullish cross with the MA200 in the very near future. That is an interesting sign for many different reasons.
RSI: Litecoin is on the verge of dropping out of overbought territory all of a sudden. That is uncommon where crypto assets are concerned as of late. With the RSI angling down at a steep angle, it will be interesting to see how the market responds in general. It seems unlikely that the $80 level will be reclaimed today, unless the Bitcoin price begins moving up once again.
Fibonacci Retracements (LTC/USD): Two Fib levels have come into play for Litecoin over the past few days. First of all, the 50% Fib is still within reach, but it may take a while to get there. Currently, the 38.2% Fib needs to act as support, which seems to be working out quite well. The coming hours will prove crucial in terms of finding support, however.
Resistance Levels: Right now, the current support level is also a resistance at $78.5. The next major resistance is the 50% Fib at $90.49. Other small resistance can be found near $78.84, $79.58, and $80.32. When those will come into play exactly, remains to be determined.
LTC/BTC Technical Indicators
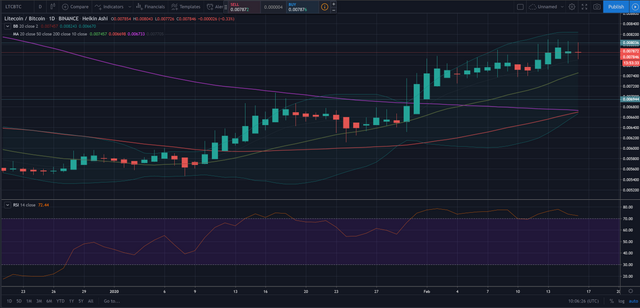
Bollinger Bands: The BBs for LTC/BTC are also wide open, yet also show signs of narrowing quite a bit. This may hint at some accumulation throughout the remainder of the day before the next stage occurs. That stage can easily be upward or downward, as there is ample of volatility.
Moving Averages: The MA20 for LTC/BTC keeps pushing higher, as does the MA50. With the MA200 still sloping down steeply, a bullish crossover by the MA50 is expected in the next 72 hours. That is a potential sign of LTC/BTC pushing higher, as today's red candle has virtually no body and is all wick so far.
RSI: Despite seemingly continuing the uptrend, even LTC/BTC finds itself in declining RSI territory. After spending so much time in overbought territory, a downward slope was merely a matter of time. For now, it should not have too much impact on the price, but weekends are always unpredictable.
Resistance Levels: For now, LTC/BTC is on the verge of hitting a resistance at 0.007873 BTC and 0.007948 BTC. Further up, the 0.008029 BTC level may be a point of contention as well. None of these levels will pose any major problems on their own, although it primarily depends on what will happen to Bitcoin in the coming days.