You are viewing a single comment's thread from:
RE: SunContract (SNC) Bullish 5th WAVE to come?
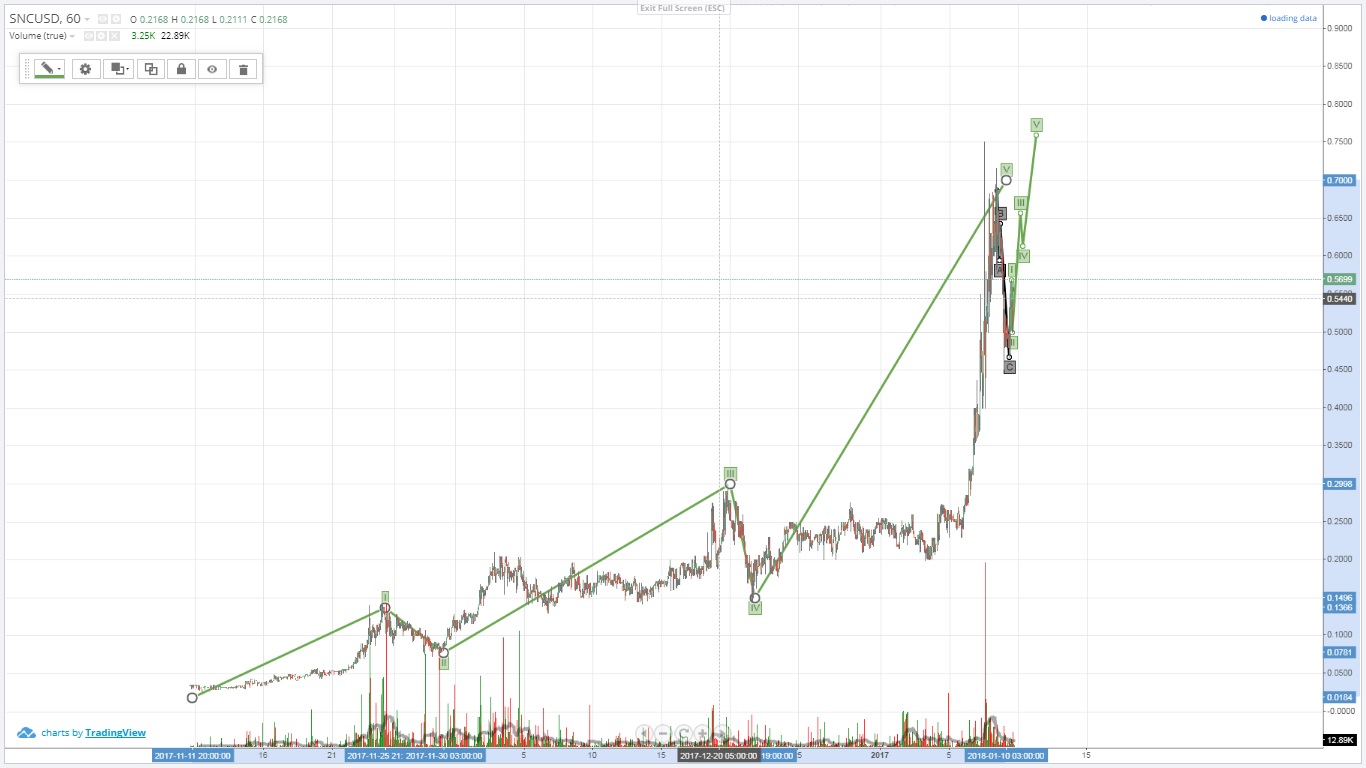
So this is my chart. I started the wave one after initial downtrend of SNC ended. And don't mind the right side, of the chart, my first try to understand that correction failed hard. I was way too optimistic :D
And I think most deforming thing is that you can put only minumum of 100 satoshi as a price in SNC/BTC pair. So the price jumps 100 points like crazy.
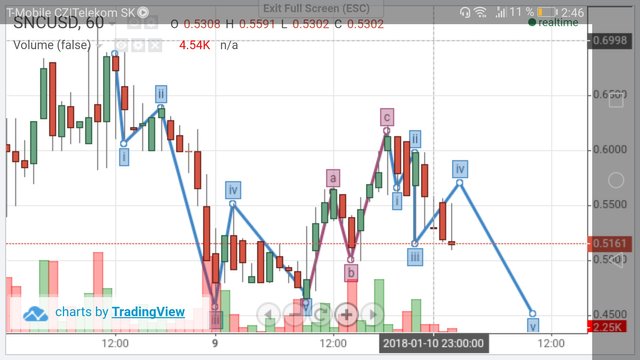
And this is alternate zig - zag correction. As of now, it seems legit when I look where SNC/USD had moved.
The funy thing is, I think even thou we did chart in diferrent way, target is basicaly the same. I would also guess around 1,4 USD.
I think the first wave from lowest low happened 24-28 october, a month earlier than your 1. Divided in two cycles and a correction like I did you can zoom out and you see the cycles forming 1. and 3. waves of a greater cycle. This means even more profits after our target is reached.
Yes, there is many ways to rome obviously :)
Actually, I also started 23rd october. But 1 hour chart didn't loaded that far in history, so i just started wave 1 at price from that date. In the end, it is about the price step and time is not important. (I think I learned that from on of your comments.) Definitely where the downtrend of initial listing ended.
Many ways to Rome, yes :D
And a lot to learn for me.
Thanks!
I usually start in 1day chart, draw the waves as I see them there. Then zoom to 4 or 1h and count the subwaves to confirm or correct the greater waves.
We both got a lot to learn, but sharing and discussing is like learning in fast lane :)
Absolutely. :)