Are Alt-Coins Price Performances Diametrically Opposed to That of Bitcoin?

Green and Red Tides
Have you ever noticed from your perusals of coin pricing platforms that Cryptocurrencies generally behave like the tides? Crypto-currency prices generally rise and fall together: they mostly all flash red, or they mostly all flash green. You never really see a randomly dispersed set of reds and greens which is what you might generally expect if each crypto-currency was largely independent of the others. More traditional markets generally show a dispersed spread of reds and greens - outside of market panics or crashes, that is.
I'll come back to that point in a second but, in the meantime, I'll relate a conversation I had recently with a friend who was adamant that crypto-currency adopters can be split into two groups - the first, he says, is comprised of active holders. They are constantly gallivanting around the crypto universe in search of the same exponential gains that early Bitcoin had demonstrated.
The second group, he says, is composed of sloths - people who are simply sitting on their holdings, generally in Bitcoin, or people who have just recently come onboard and are still learning the ropes. The sloths have a net aggregate effect on the market which is disproportionately low - except, perhaps, in periods of extreme market behaviour.
"Fair enough," I say. "And the point?"
"Well," he says, "you're right about cryptos rising and falling together but only up to a point. Your observation, only applies only to Alt-Coins. Bitcoin tends to go in the opposite direction."
I've heard this assertion being made before but I've always been sceptical.
"OK, and what's the reasoning?" I ask.
"The actives prefer to go after the Alts," he tells me. "When they do, Alts rise in price whilst demand for Bitcoin falls. When, on the other hand, Bitcoin rises - such as periods in which we see sharp increases in the number of sloths on the back of Bitcoin falls - the actives abandon Alts and move back into Bitcoin."
There are, then, according to this viewpoint, a community of actives who swing back and forth between Alts and Bitcoin and their behaviour results in antithetical trends between Bitcoin's price performance and the general trend of price performance among the Alts.
I'm not entirely convinced by my friend's argument, but I was still intrigued by this idea that Alt-Coins might generally obey their own set of trends in a manner that is the mirror-opposite of Bitcoin. So I decided to test this graphically.
Bitcoin vs. Alts
All I simply wanted to do was graph Bitcoin performance against the general Alt-Coin universe performance. Before discussing the method used to calculate the Alt-Coin universe performance, however, it is probably best if I first of all set down how I defined that Alt-Coin universe.
There are literally hundreds of Alt-Coin out there but I decided to limit the definition of this universe initially to the 100 largest Alt-Coin by market cap (as listed on the coin market cap website).
That should cover, I assumed, the definition of sample representativity of the Alt-Coin universe. If there are any professional statisticians out there who might have reason to disagree, please do let me know where I might be going wrong here.
Using R, I ran a web-scrape of three year's daily pricing history for each of the 101 currencies on my list (Bitcoin plus the 100 Alt-Coins - I removed BitcoinCash from this latter list and replaced with the next candidate by market-cap size).
From this pricing history extracted from the coin market cap website who kindly allow this data to be distributed for free through use of their accompanying api, I extracted the 101 individual three-year weekly price performance history (as opposed to daily performance which I avoided simply for graphical aesthetics).
The Alt-Coin universe definition of performance was defined by the market-cap weighted average of price performance of the 100 constituents within the Alt-Coin universe.
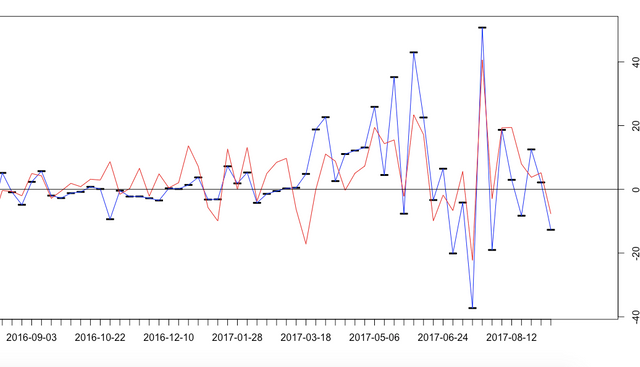
That produced two series - a Bitcoin three year weekly price change history, and an Alt-Coin universe three year price change history. I then plotted the results, a subset of which you can view below (I won't provide the entire plot for reasons related to viewability) - Bitcoin is in red, the Alt-Coin universe is in blue, price-performance is listed against the y-axis on the right-hand side of the graph.
Observations
There appears to be support for both hypotheses depending on the time frame you focus on. There was a period from around October 2016 through to early 2017 where my friend's theory seem to hold - Bitcoin performance was exhibiting mirrored behaviour to the performance of the Alt-Coin universe. When Bitcoin was performing positively, Alt Coins were performing negatively and vice-versa.
For other periods covered by the graph, however, there is a clear correlation between Bitcoin price performance and Alt-Coin price performance. Given that Bitcoin ($70 Bn USD approximately as of writing) represents almost half of the market cap of the cryto-currency ecosystem ($170 Bn USD), that can't be a great surprise.
The question, however, is - what explains the periods where we see the kind of opposition such as that which we saw around late 2016 / early 2017? It is not the only period where we see such behaviour but that period was prolonged.
Personally, I don't keep enough of a close eye on the general developments within the crypto markets, particularly external factors, to be able to discern the potential reasons for this. Perhaps there are some of you reading this who might have an idea? If so, perhaps you could share your thoughts - not least because if you have some specific explanations for periods of oppositional behaviour, that will mean the rest of us can be ready to cash in the next time the phenomenon re-occurs :-)
Thoughts, opinions, critique of the methods employed here etc. all very much welcome!
Thanks,
Great article...Thank You....Please uplike this post...TimWhoTV...
It Looks as though the volatility is highly dependent on what happens with the BRIC nations...
India has already switched to digital...A few players with lots of Crypto can highly affect the ups & downs...TimWhoTV...
Quite deep though :) Yeah, the trends that we see know mostly look to be generated by influence groups that pour and retreat fiats, managing to speculate on the price so only they could know what will happen for sure..
Thanks for reading! Following...feel free to follow me back. Just back to your point, I have come across that argument before but, personally, I'm a tad sceptical given the market capitalisation of the volume of Bitcoin that is being traded. Unless you're referring to early adopters of Bitcoin with large holdings who are manipulating the price by selling to themselves?