The evolution of price divergence trading
It's been a while since I have posted because I have been hard at work perfecting volume correction trading, trying to nail down how to get the perfect entry and exit points. The chart gets a little messy but it has worked out quite well.
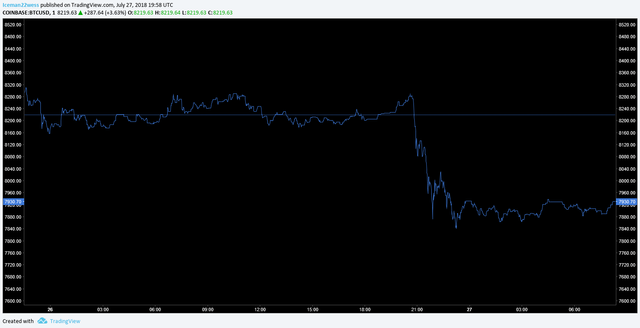
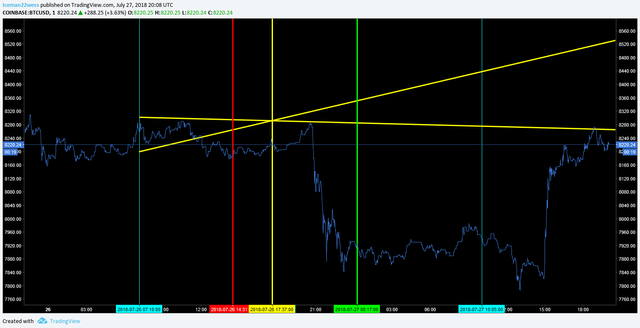
Starting with this big down fall in BTC price for example on a tiny 1 min chart. (Yea, it works on a 1 minute chart too!)
First thing I am going to do is draw a random regression to the mean, and project that same distance out into the theoretical future.
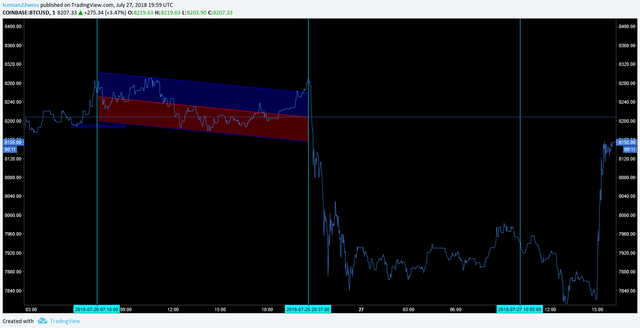
Here is the trend correction after it is plotted.
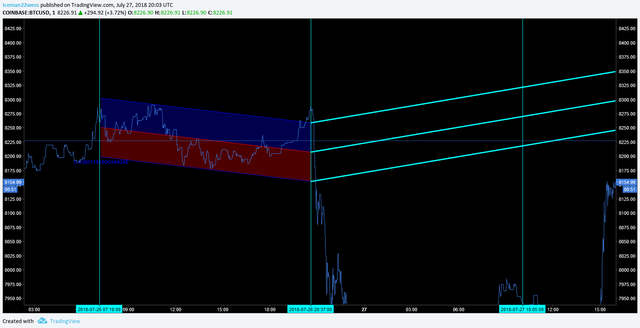
These two added fib levels provide cross locations which give me buy and sell signals. There are a few rules to it that I won't explain, but enjoy.
Now I can clean up the chart for a better view now that I have my plotted points of trade. Except for the yellow lines, they are important for other reasons.
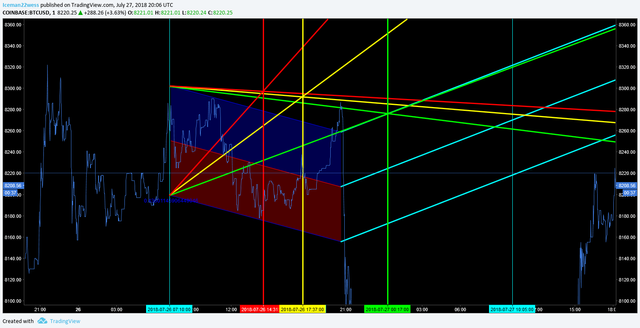
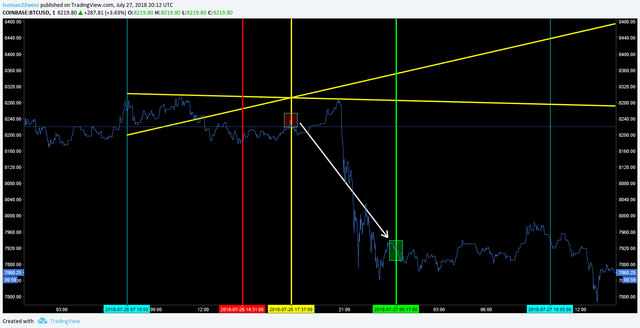
Now, the red line is a sell signal, but the yellow line after it is a trend reversal signal. Since the trend into the red line is down, I am expecting to get a better entry into a short position. So I end up taking a short position at the yellow line, and hold until the green line.
Hope that gets some people interested in researching volume divergences because it's quite amazing.
Thanks for reading,
-Icee-
Please leave me an upvote and remember this is not trading advice.
Hey bro, glad to see u back on steemit.. any chance ur gonna do a btc post soon?
Yeah I'll make one right now, I havn't been trading it for a while. I'll make one for you =)
Thanks bro, I was getting spoiled by your awesome analysis and then you disappeared for a week! lol..