Price Analysis: Ripple (27/6/2018) | Beware that there is nothing shiny on these charts, a decline is to be expected.

Markets are red with every Altcoin dumping currently together with Bitcoin (BTC). We have recently reviewed Bitcoin in our Price Analysis series and are hoping for a bottom, but the Ripple (XRP) chart makes us feel like we are still not there yet.
Even though fundamentally speaking Ripple has bagged several partnerships recently including a Kuwait based bank and Currencies Direct, currently banks skip using XRP as a means of transacting value even when using the companies products. This means that there is no real use case for the token itself, which results in heavily dropping prices after every big announcement and market cycle.
Coin holders can breath up soon hopefully as Ripple's CEO announced on CNBC earlier this month that the company is developing a product for cross-border transactions that will fuel the adoption of the network's native currency.
Now to the technical part, we wanted to showcase the BTC/XRP chart via Bitstamp first as this has some obvious fractals, which might be in play now:
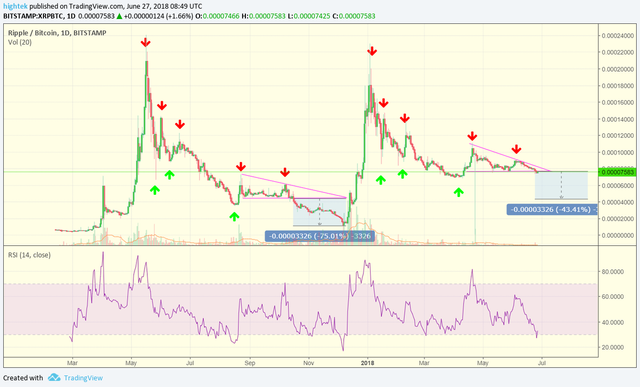
As you probably noticed the 2 previous market cycles are almost identical so far, worth to note that there was a mini-cycle prior to these. The first major cycle has resulted in a higher bottom compared to the bottom of the mini-cycle and we are expecting a higher bottom from the current cycle as well.
Both peaks ended with a heavy downwards slope and a spike down followed by a dead cat's bounce and another last bounce to crown the downtrend. After the sell-off, in both cases, we saw a descending triangle (pink) forming. This has previously shown us the last run down followed by the start of the next cycle. Currently the descending triangle has broken down already and we are expecting a major movement down following soon.
According to the fractals the sell-off should last until the end of the summer (August) where we will see a new higher bottom followed by the start of the new cycle somewhere in autumn.
Now let's look at the XRP/USD chart:
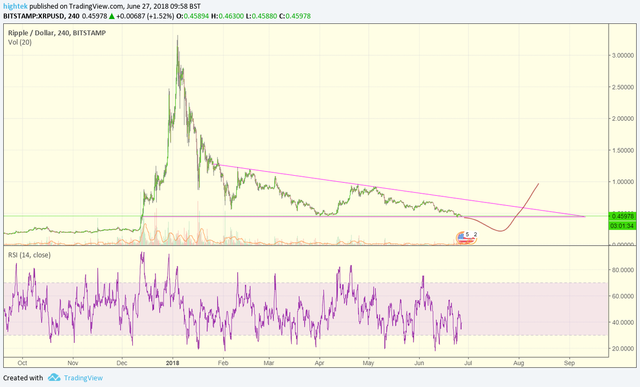
We can see the same descending triangle (pink) on this chart that was seen on the Bitcoin chart a few weeks ago before it broke down to the state it currently is in. The BTC/XRP chart indicated that we are still in correction and this chart doesn't raise confidence in us either.
Follow my charts and news on WalletInvestor.com
@hightek thanks for sharing an educative post. We are hoping the general cryptocurrency market will bounce back
I hope so too, but looking at Ripple we might still have 1-2 heavy months ahead. Bitcoin on the other side though might stop here and just move mostly sideways for the same time frame.