NANO Price Analysis: Are The Altcoin Bulls Back?

Nano (NANO) has been one of the most hyped projects both during last year and during 2018 as well. Nano was between the first projects to use a Directed Acyclic Graph based chain that eliminated inflation and the need for Proof-of-Work based mining to solve the scalability issues that have been affecting both Bitcoin and Ethereum back during the last crypto boom earlier this year.
After the project landed on several exchanges and peaked price-wise in January, several news bits started going around that Nano’s method for scaling isn’t without the risks of centralization as they use a form of DPoS for an anti-fork measure and also a form of PoW to stop spam attacks on the chain. Since this point exchanges and Nano supporting ventures (including Binance) started running their own delegates to support the network and centralization started shifting away from the nodes of the developers.
Recently Colin LeMahieu, who is the lead developer for Nano, and the project itself started gaining traction again. Colin was also invited to the Voice of Blockchain 2018 event where he explained Nano’s scalability solution and the current TPS limits on the Solving Scalability Panel. It turns out Nano can do several hundred transactions per second already, but the theoretical limits for a healthy network should be in the range of thousands.
CHARTS
The Daily NANO/BTC chart, when zoomed in, shows us that the falling trend that has been ongoing since March this year has fallen back in August. Since that moment there has been an extremely high volume on NANO, it reached the 2000-5000 daily BTC volumes constantly only on Binance.
Since the break of the trend, NANO’s price also managed to break out of a falling wedge after the initial pump, which broke through a possible resistance zone and went right into the next one, only to later form a bull pennant after correcting back to the first resistance for further accumulation.
We are expecting the chart to form a double top by the end of October the latest.

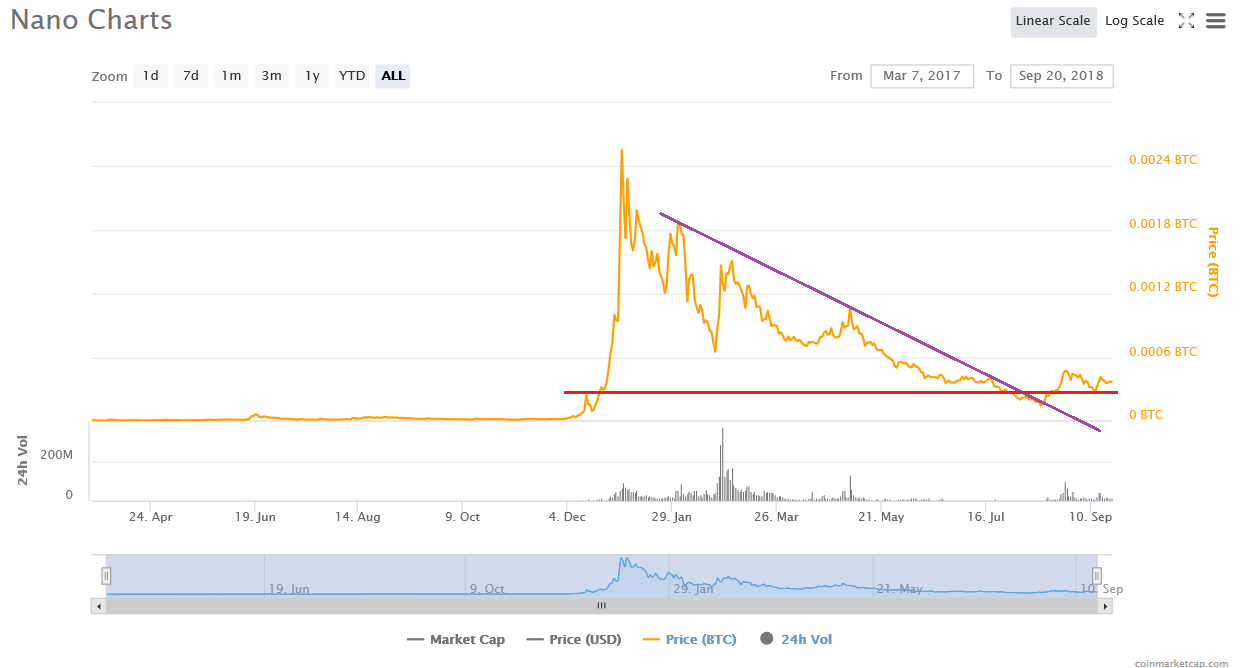
The Historical NANO/BTC chart can only be found on Coinmarketcap, as NANO could only be traded on smaller exchanges before the run-up in December. The chart amazingly displays us that the falling trendline lead the price down below the only major historical resistance only to bottom out and bounce back. The price successfully retested this resistance, thus resistance turned support.
Follow us on Walletinvestor.com
Congratulations @hightek! You have completed the following achievement on the Steem blockchain and have been rewarded with new badge(s) :
Click on the badge to view your Board of Honor.
If you no longer want to receive notifications, reply to this comment with the word
STOPCongratulations @hightek! You have completed the following achievement on the Steem blockchain and have been rewarded with new badge(s) :
Click on the badge to view your Board of Honor.
If you no longer want to receive notifications, reply to this comment with the word
STOP