EOS might be nearing the bottom according to a look into the charts (Price Analysis | 10/8/2018)
EOS (EOS) has been one of the most controversial Cryptocurrency projects to date. The reasons for this is, while the project raised 4 billion USD in funding and became the highest funded blockchain startup to date, there also have been many problems surrounding it during the first few months after the official launch.
Nevertheless, the fundamental reason why most EOS believers can be bullish on the long-run is that the project has more than enough funding to kick start the growth of the ecosystem. Firstly EOS announced a 1 billion USD developer fund back in 2017 and now recently the company behind the project, Block.One, also announced that Bitmain and Peter Thiel were leading their last investment round.ű
Charts

The EOS/BTC chart shows us a break down under the long-term trendline (red), which means that we will start a new cycle in the life of the coin.
The price movement is also stuck in a rather long descending channel (pink), which could indicate a reversal or at least a break out soon, especially since our RSI indicates an oversold chart pattern, that only happened twice before historically and one was just recently.
The bottom box indicates a historical accumulation zone (orange) that has been the starting grounds for 2 cycles previously. We don't expect this zone to hit, but are actually looking at its topside (green) for a potential buy zone, as that would be our major support here with high vol swings previously.
In case the price doesn't hit your targets, look at the break of the descending channel for a good entry.
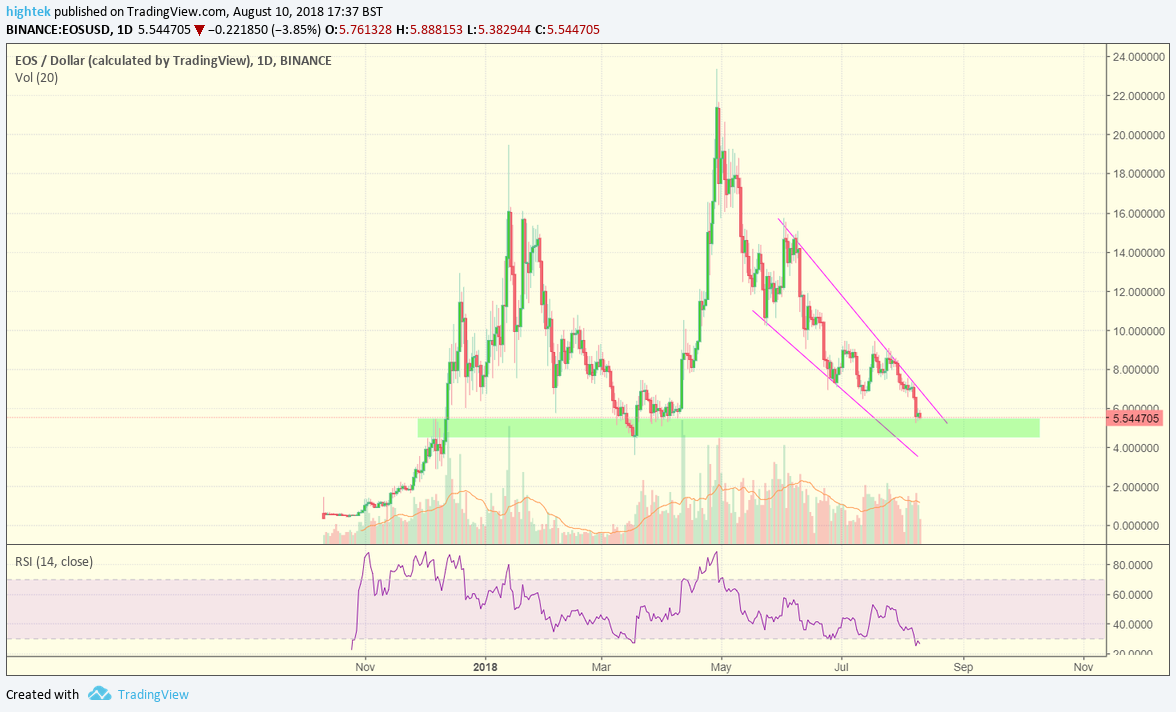
The EOS/USD chart shows us a similar pattern. The price is currently moving in a falling wedge pattern (pink) and has hit a historical low on the RSI graph. We also came close to the potentially last and biggest support and buy zone (green). EOS holders will be probably looking at hard weeks ahead in case we go below this zone as that would mean that confidence in the market has finally broken.
On the positive side, both charts look like the bottom should be near. In case you are looking for entries, put in tight stop losses and wait for the potential bottom.
How do you think @hightek what will happen next?
I'm expecting EOS to bottom out soon together with almost all altcoins. We are looking at 85-98% drops all over the board. I would look at buying between the 70k and 80k satoshi range, which would hit the 'despair' phase after breaking down from a longterm trendline.