DASH broke out of a 7 month falling trend line, but will it close outside? | Price Analysis: DASH (13/7/2018)
Background & News
Dash (DASH) has been one of the oldest cryptocurrencies to date that managed to achieve and maintain a high market cap. This has been partly because of an ever increasing number of MasterNodes on the network. Dash's creator, Evan Duffield, was the first developer to implement the feature that has been since seen on hundreds of cryptocurrencies.
The main idea is to incentivize nodes for their work on the network. Here MasterNodes govern the network with voting and they also control features like InstaSend and PrivateSend. One is a way of speeding up transactions the other is a decentralized CoinJoin implementation.
Masternodes require 1,000 DASH and this results in a lower liquidity on the market, meaning fewer coins are present. Since DASH is a well marketed project, this will generally result in low supply and high demand.
Future developments will include Dash Evolution, which is a huge update planned for 2018 that will introduce light wallets (SPV clients), an integrated payment processing feature, a decentralized shared file system labeled DashDrive and features like friends lists with shared multisig accounts.
Charts
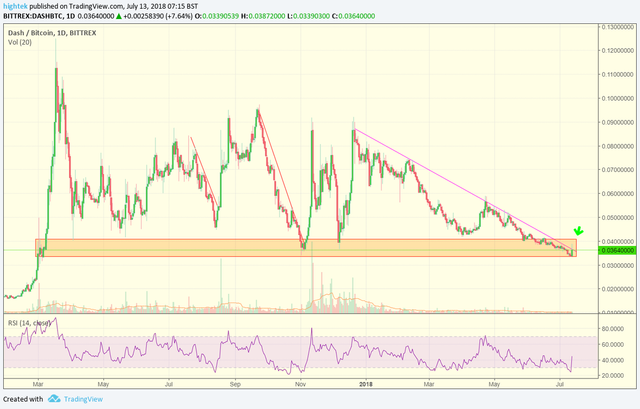
The BTC/DASH chart looks quite good at this point. We have a falling trend line (pink) of more than 7 months that the price is attempting to break right now. Currently only the wick is out, but the daily is still not closed yet. Closing out of the trend would be bullish for DASH and could imply a new market cycle as we are currently in a historical bounce zone (orange). Getting denied on the trend line by a fake out and dropping below this zone would offer an extremely good shorting opportunity, but considering how controlled the DASH market is we would expect it not to happen.
Also historically there were several sharp declines (red) that all resulted in very profiting trades. We have to also consider that DASH's Evolution is releasing this year.
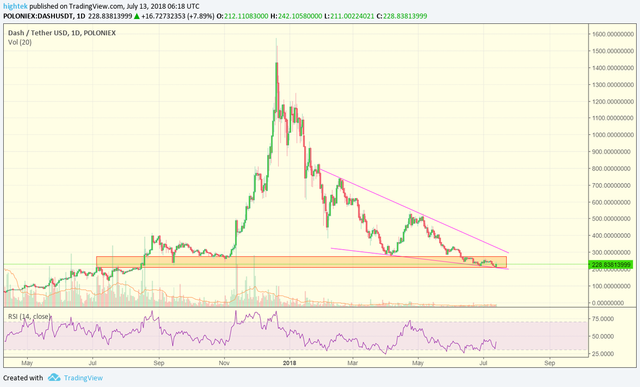
The DASH/USD chart has a similar feel to it as the price is in a historical support zone (orange) currently and at the bottom of a possible falling wedge (pink). Breaking below this point would mean that we are going back to 2017 mid-year price levels, which seems unlikely right now, but we have to look out for BTC movements as well.
Follow my charts on WalletInvestor.com/Magazine
How do you think @hightek what will happen next?