Ripple (XRP) Technical Analysis (with Price Target)
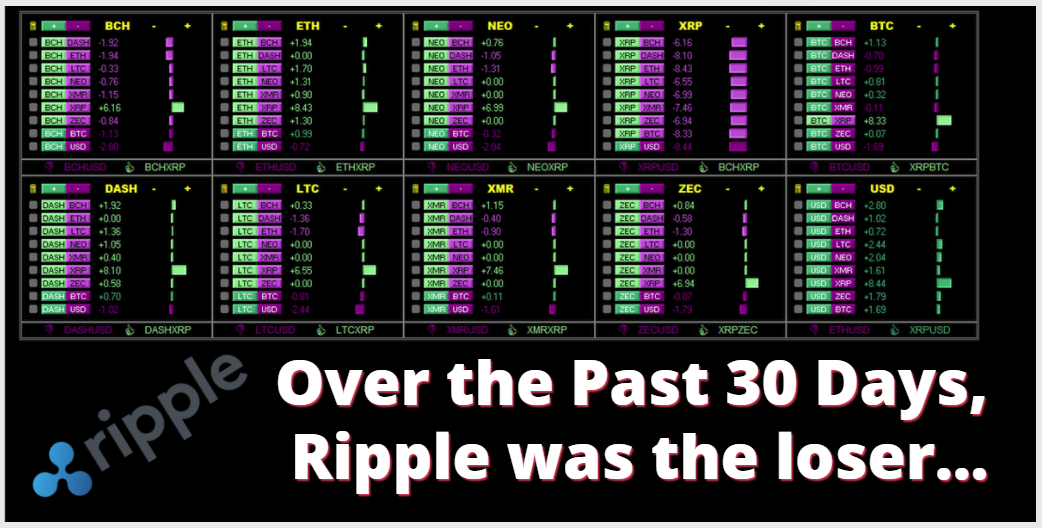
Ripple was the worst performer, out of most of the major cryptocurrencies, over the past 30 days. Is there a fundamental or technical reason why? Let's investigate...
Maybe Ripple isn't correlated with the rest of the market...
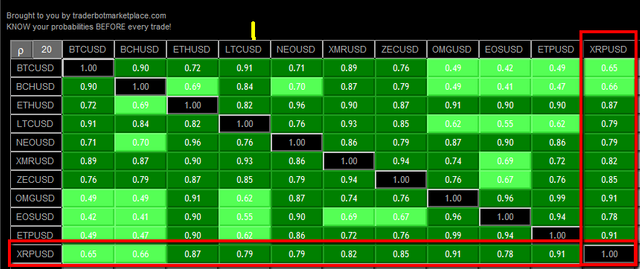
You can see, by looking at this cryptocurrency correlation map, that Ripple is mostly correlated with the majors. When they all go up, Ripple goes up. When the rest go down, Ripple goes down.
So we know that the reason Ripple is the laggard isn't because they are not correlated. This is showing the correlation over the past 20 weeks.
Take a look at the next picture and you will see that over the past 20 months, Ripple is even more correlated with the majors.
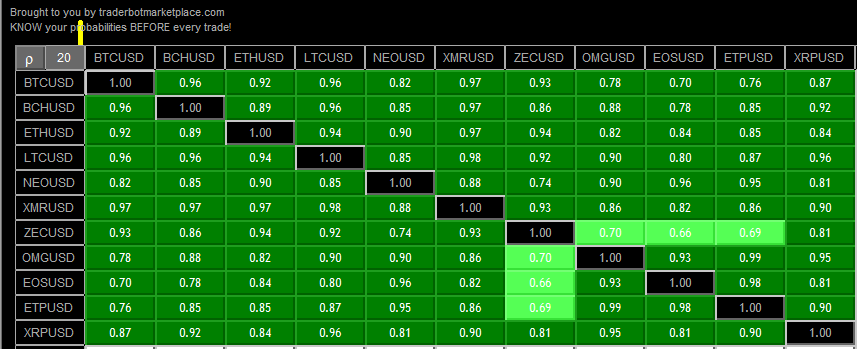
We can mark this off. Ripple is in line with the rest of the market.
Partnerships, Maybe?
I did a quick Google search and this is what it spit back out at me...

The reason is not because Ripple is a sucky company. They are adding partnerships and banks left and right. It's like every week, they have a new partnership.
From a purely fundamental setting, Ripple has the capability to go to $100 per coin over the next 10 years or whatnot, if all of the banks came on board. Their technology saves the banks a ton of cash and saves the consumer days of waiting.
It must be a technical reason.
Does Ripple follow Technical Analysis rules?
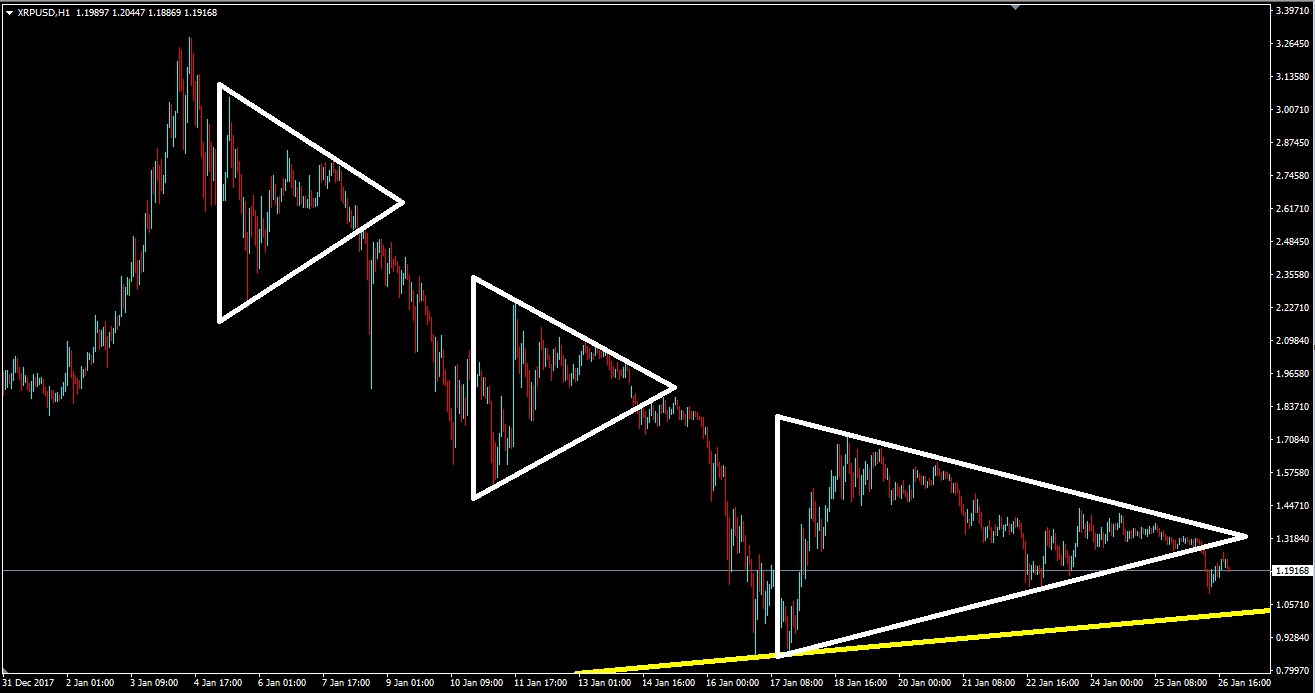
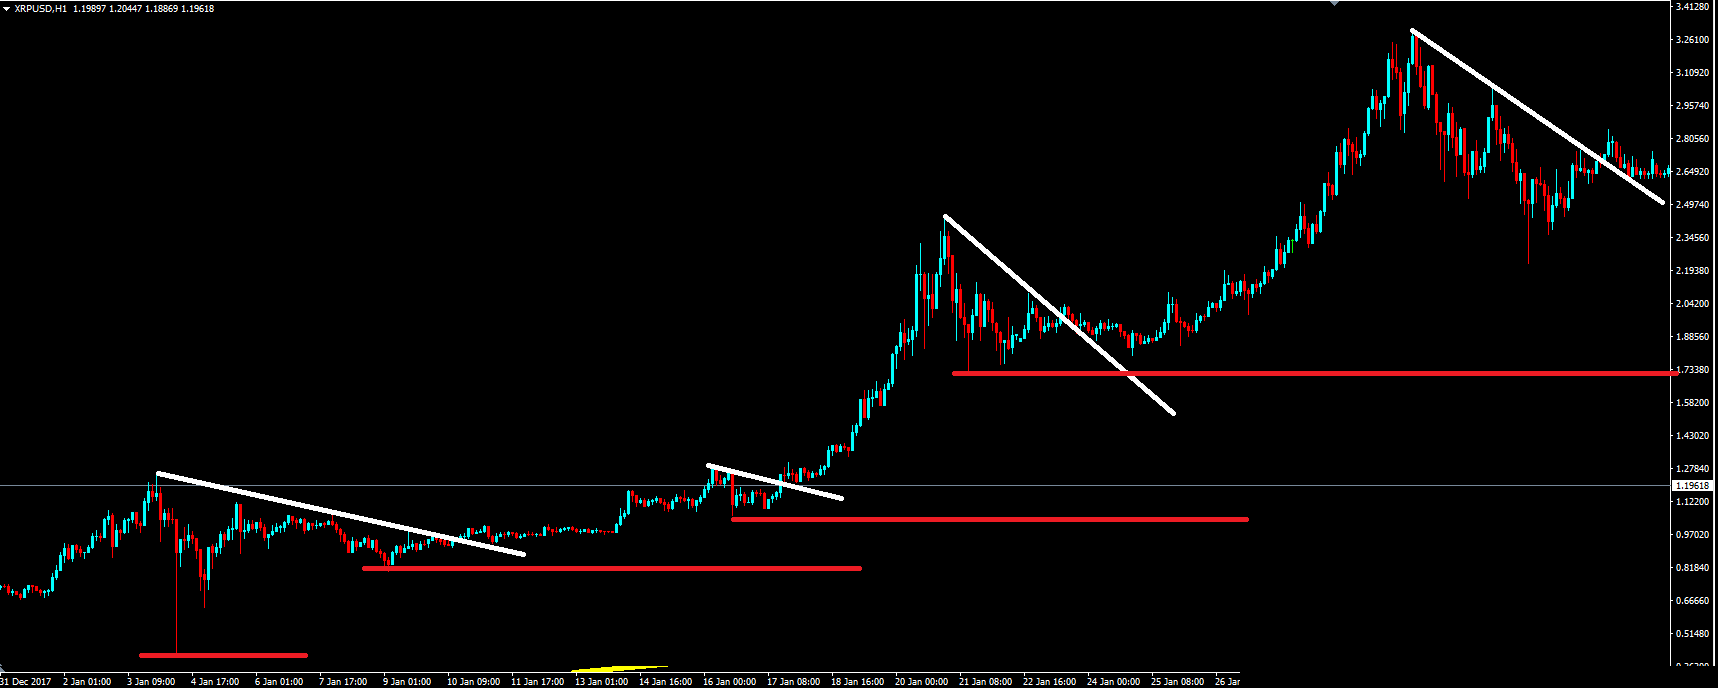
Take a look at the 3 triangles. These are basic technical analysis tools. So far, XRP has behaved normally and within the bounds of the 'norms' of triangle breakouts and break downs.
Let's scroll back in time and take data from various points in Ripple's massive growth and see if these charts follow typical technical analysis, as well. Remember when Ripple was like $0.15?...
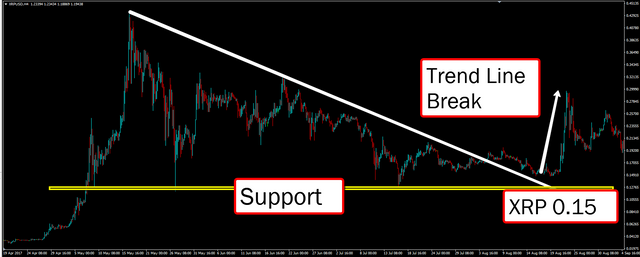
Let's take a look at the trend line breaks on the run up...
Do those look normal? Yes they do. You could not tell the difference in this chart or a typical stock chart.
I assume, based upon my research into the history and analysis of Ripple that this asset does follow typical technical analysis and based upon that, I can draw my hypothesis on what may happen in the future.
Do You See What I See?
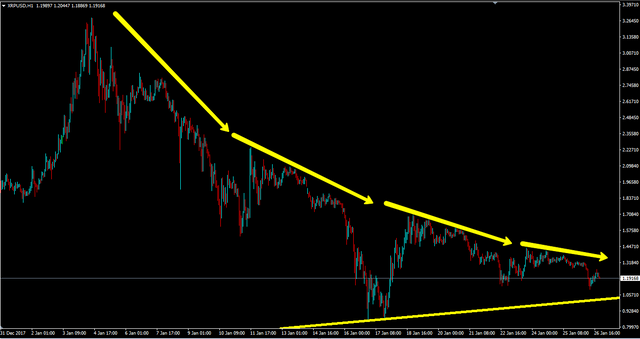
This picture shows that Ripple 'Seems' to be bottoming out.
From my perspective, it 'looks' like it may do this...
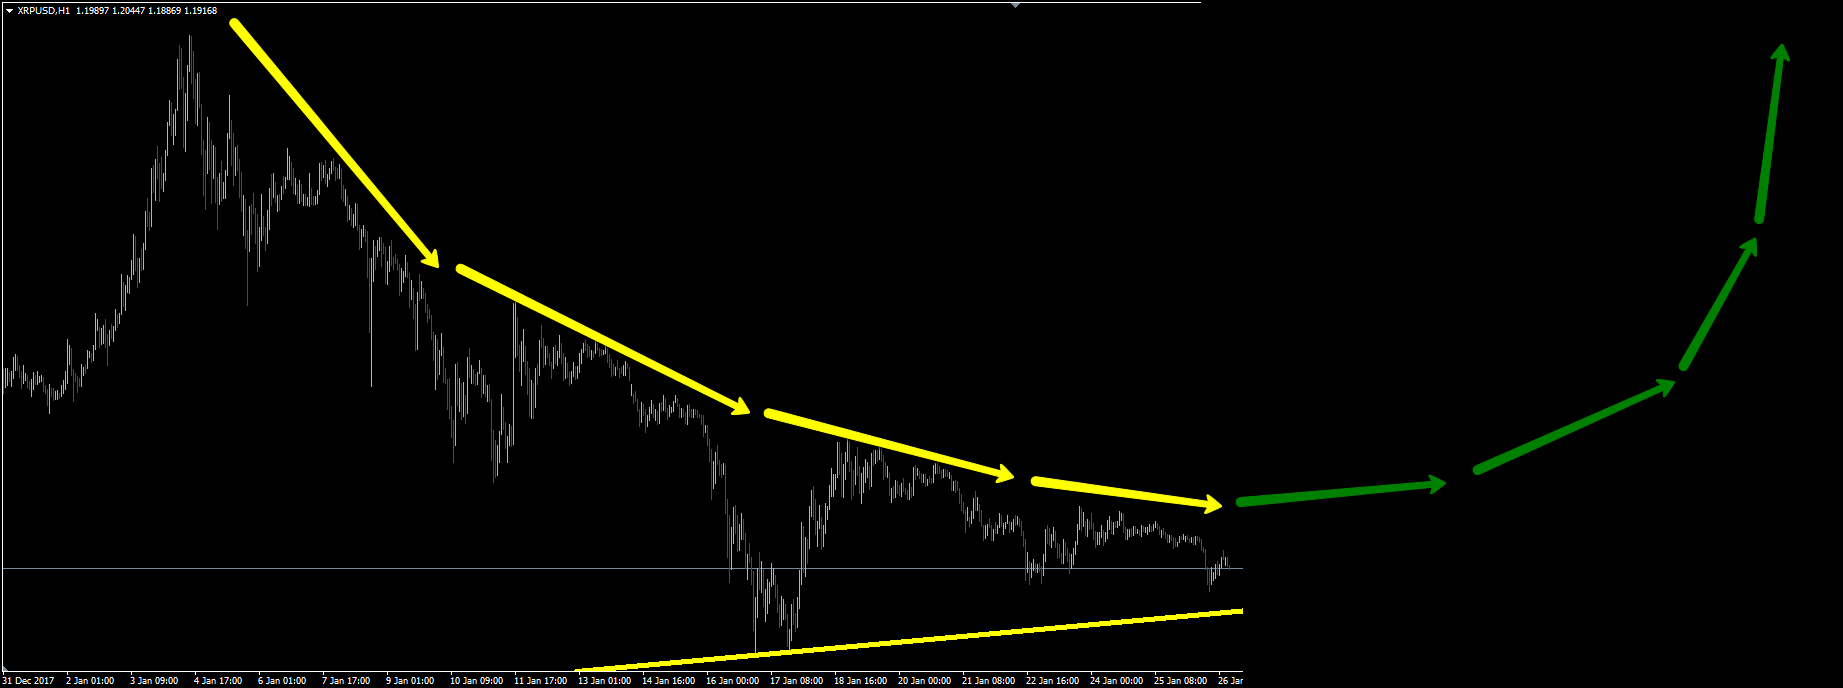
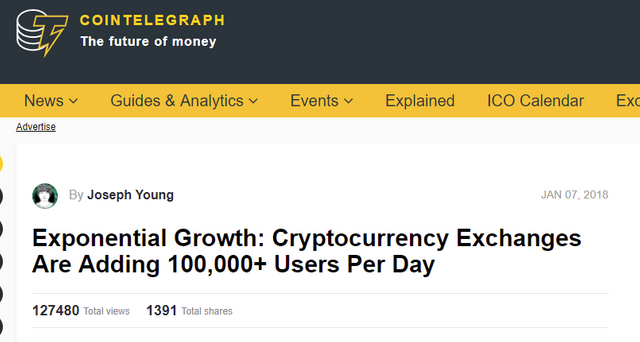
Why do I believe price will climb faster than if fell? The number one reason is the fact that so many people are piling cash into cryptocurrencies right now. The numbers are mind boggling.
Check it...
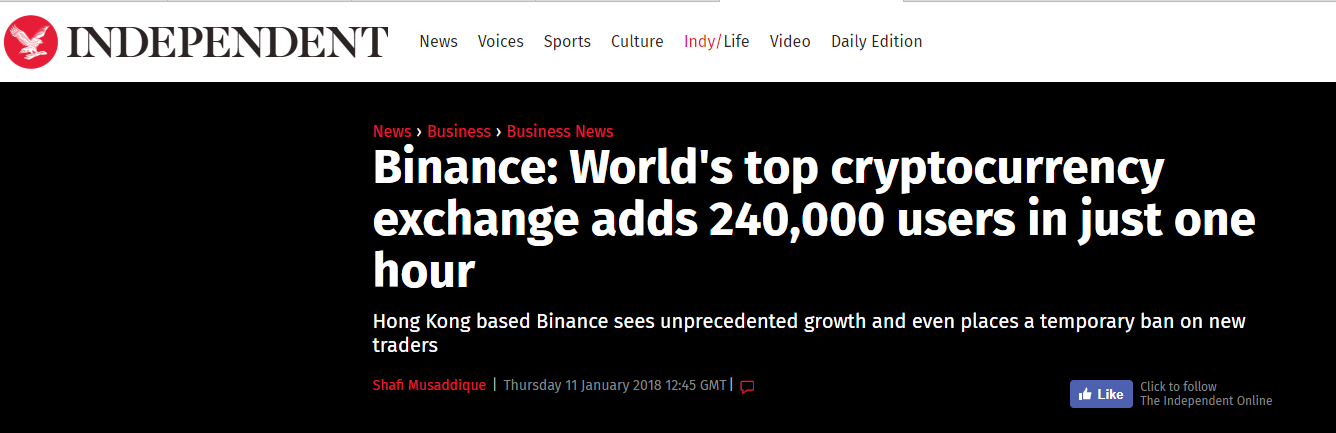
...and this one...
Conclusion
Cryptocurrency brokers are turning traders and investors away every day because they don't have the manpower to handle so many requests.
More and more money will continue to flow in.
If people are getting turned away every day, when they are trying to set up accounts, then billions of dollars are sitting there waiting to be used.
Once traders are confident that Ripple will rise, they will take money out of their Tether and push price up to $5 or $10 before the next downturn. This process of up down up down will continue until Ripple and the rest of Crypto-Land is mainstream news, every day, with tickers running on CNBC.