[Analysis] All Cryptos Market Cap: Where Are We Headed? (Graphs + Video + Text)
At this time of uncertainty I think that it is a good opportunity to look into all cryptocurrencies at once. Unfortunately, you cant do that via Trading View but you can do it over at:
https://coinmarketcap.com/charts/
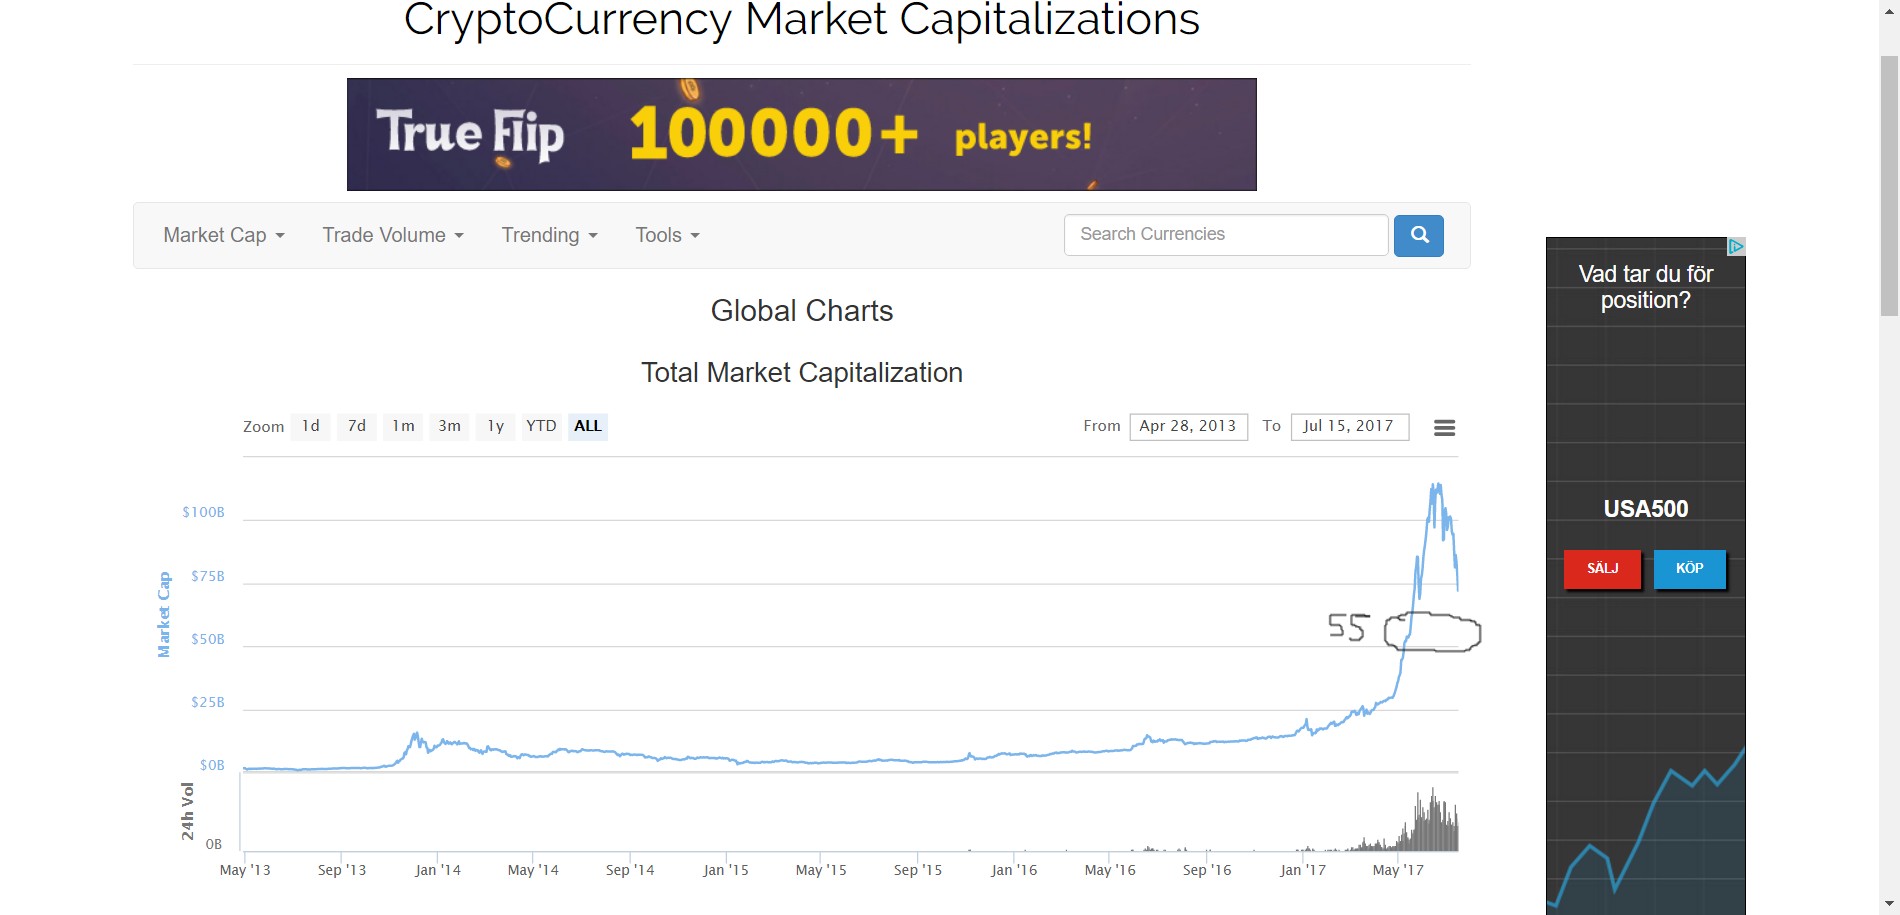
In this long term graph from 2013 we can see the market cap of all cryptos including the big ones such as Bitcoin, Ethereum, Ripple and Litecoin.
.jpg)
From the graph you can see the major move up that started in May of 2017 and it has only lasted about 2,5 months. Compare that to the Nasdaq bubble which lasted about 2 years.
Anyways, the recent market cap peak was around 113 Billion USD and a regular retracement usually fall back about 50% and that would take us down to about 55 Billion USD.
At this time, the total market cap is hovering around 72 Billion USD. That would mean that we could still fall another 17 Billion give or take. In percentage that is 23,6% so the fall could be fairly substantial.
Its hard to see support on this long term chart, but if we have a look at the 3 months chart, we can clearly see that there is support around this 55 Billion USD area:
.jpg)
So, my conclusion to all of this is that Bitcoin, Ethereum and all the other cryptos will continue to pull back and in Bitcoins case it could mean 1700-1800 USD and for Ethereum 130-140 USD.
If you want to watch a more detailed video analysis you can do that right here (7 min):
Happy trading!
this looks sad :'(
yeah, but lets compare this upmove to the Nasdaq bubble which lasted about 24 months, this one has only been around for 2,5 months, so there is a lot of potential going forward
Oh boy... @freeforever,
we need more people like you on this channel.
Damn cryptoz.
I'M FREE. FREE FALLING
free falling, that was a good one;)
thanks for the analysis. Where do you think that it will go from there ones the correction has been made and we hit 55 billion?
oh, its really hard to tell, but there is something called a range doubling, so if it falls back to 55 billion, that could mean that the next target up is "last top + trading range" or 113 + 55 = 168 Billion.
I like those numbers!