Cryptocurrency and ICO Market Analysis (April 9-15, 2018)


This report presents data on the cryptocurrency and ICO market changes during 2017-2018. Special emphasis has been placed on an analysis of the changes that have taken place in April 2018, including over the past week (April 9-15, 2018).
Information as of April 16, 2018
Professor Dmitrii Kornilov, Doctor of Economics, Member of the Russian Academy of Natural Sciences, and Leading Analyst at ICOBox
Dima Zaitsev, PhD in Economics, Head of International Public Relations and Business Analytics Department Chief at ICOBox
Nick Evdokimov , Co-Founder of ICOBox
Mike Raitsyn , Co-Founder of ICOBox
Anar Babaev , Co-Founder of ICOBox
Daria Generalova, Co-Founder of ICOBox
Cryptocurrency Market Analysis (April 9-15, 2018)
1. General cryptocurrency and digital assets market analysis (by week, month, quarter). Market trends.
1.1. General cryptocurrency and digital assets market analysis (by week, month).
1. General cryptocurrency and digital assets market analysis (by week, month, quarter). Market trends.
1.1. General cryptocurrency and digital assets market analysis (by week, month).
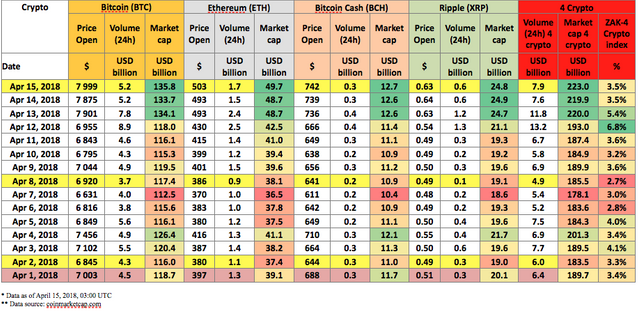
Table 1.1. Trends in capitalization of the cryptocurrency market and main cryptocurrencies from January 1, 2018, to April 15, 2018
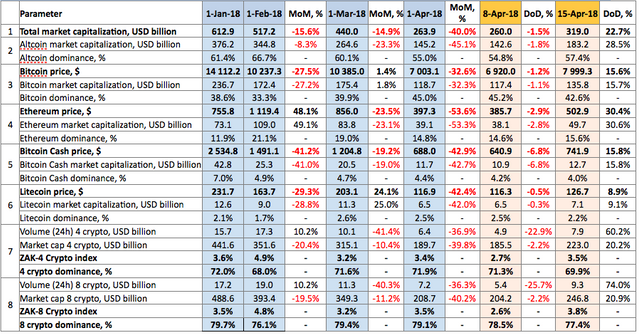

Over the past week (April 9-15, 2018) cryptocurrency market capitalization increased, and equaled $319 billion as of 03:00 UTC on April 15 (see Table 1.1, fig. 1). Two-thirds of capitalization growth during the week was due to the growth of altcoins (+$40 billion) and 1/3 was due to the growth of bitcoin (nearly +$20 billion).
The dominance of the four and eight largest cryptocurrencies as of 03:00 UTC on April 15, 2018, equaled 69.9% and 77.4%, respectively, with bitcoin dominance decreasing to 42.6% (see Table 1.1). The fairly robust growth last week in cryptocurrencies from the second (top 100) and third (top 500) echelons by capitalization should be noted. For example, Mithril (+242.17%), BABB (+235.36%), Matchpool (127.42%), Golem (110.29%).
The fluctuation in capitalization over the week equaled $80 billion, from $255.6 billion to $335.6 billion (fig. 1), with growth skyrocketing on April 12 by nearly $30 billion in one hour (including due to growth in the bitcoin price by $16 billion).

Figure 1. Cryptocurrency market capitalization since April 9, 2018
During the period from April 9-15, 2018, the price change of cryptocurrencies in the top 500 ranged from -34.75% (Mooncoin) to +1,335.59% (Greencoin). However, the 24-hour trading volume of Greencoin fluctuated this week between $100 and $10,000. Due to the low trading volumes, the price of this currency is extremely volatile. The price of all the cryptocurrencies and digital assets in the top 100 showed growth, and only 22 of the top 500 currencies showed a decreased in price. Overall, cryptocurrency market capitalization increased by approximately 24%, or by $60 billion, over the week.
This past week the number of cryptocurrencies with a capitalization of more than $1 billion increased from 19 to 23, with the change in their prices ranging (not including Tether) from +7.17% (Binance Coin) to +53.13% (IOTA).
The coins and tokens from the top 100 that demonstrated the largest growth in prices are given in fig. 2.
The rise and fall of cryptocurrency prices over the past week (April 9-15, 2018)
The prices of some cryptocurrencies may fluctuate from -50% to +50% over the course of a single day. Therefore, when analyzing cryptocurrency price trends, it is advisable to use their average daily amounts on various cryptoexchanges.
Below we consider the 10 cryptocurrencies that demonstrated the most significant change in price over the past week (fig. 2-3). In this regard, only those coins and tokens included in the top 100 in terms of market capitalization (according to the data of coinmarketcap.com) were considered.
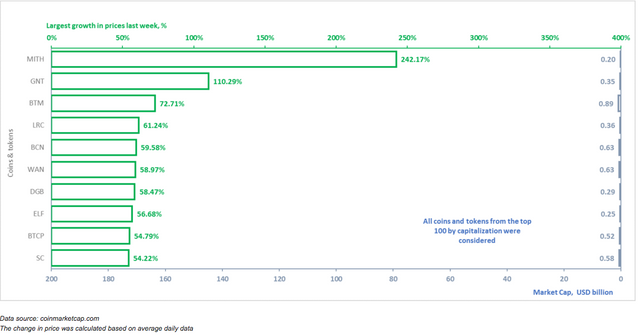
Figure 2. Largest growth in prices over the past week
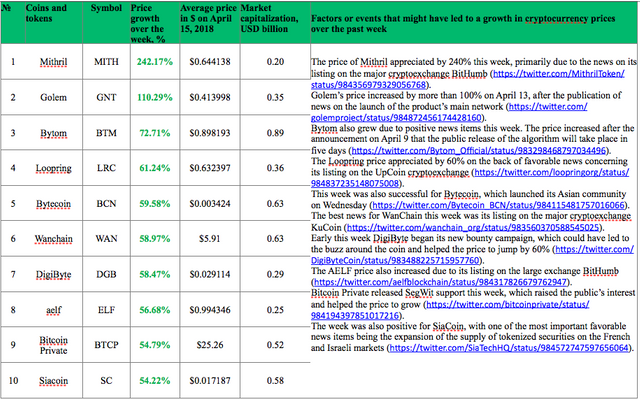
Tables 1.2 and 1.3 show the possible factors or events that might have influenced the fluctuation in prices for certain cryptocurrencies. Table 1.4 shows the possible factors or events that might have influenced the cryptocurrency market in general.
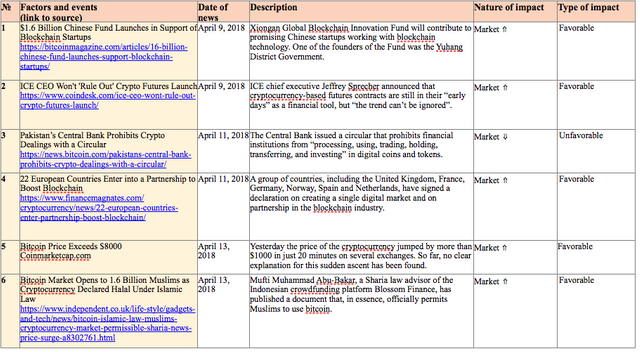
Table 1.2. Factors or events that might have led to a growth in cryptocurrency prices over the past week
A depreciation in price was seen for 22 coins and tokens from the top 500 cryptocurrencies and digital assets by capitalization last week. The ten cryptocurrencies from the top 300 that experienced the most noticeable drops in price are shown in fig. 3 (Table 1.3)
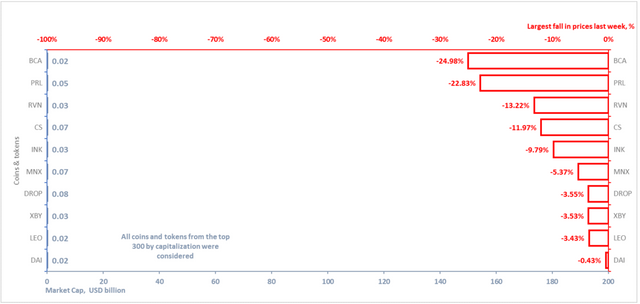
Figure 3. Largest fall in prices over the past week
Table 1.3. Factors or events that might have led to a fall in cryptocurrency prices over the past week

Table 1.4 shows events that took place from April 9-15, 2018, that had an impact on both the prices of the dominant cryptocurrencies and the market in general, with an indication of their nature and type of impact.
Table 1.4. Key events of the week having an influence on cryptocurrency prices, April 9-15, 2018
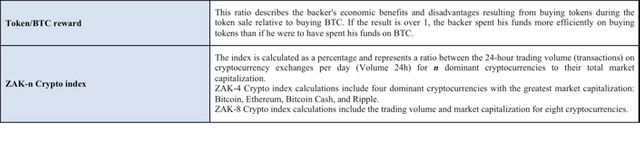
To analyze trading activity on cryptocurrency exchanges, the ZAK-n Crypto index is calculated (see the Glossary). The values of the ZAK-4 Crypto and ZAK-8 Crypto indices are presented in Tables 1.1, 1.5.a, and 1.5.b. In early April the 24-hour trading volumes (Volume 24h) for the four dominant cryptocurrencies (Bitcoin, Ethereum, Bitcoin Cash, Ripple) equaled from $4.9 billion to $13.2 billion (Table 1.5.a). The value of the daily ZAK-4 Crypto fluctuated from 2.7% to 6.8% of capitalization. The highest trading volume was seen on April 12-13.
Table 1.5.a. Daily ZAK-4 Crypto index calculation (from April 1, 2018, to April 15, 2018)
The 24-hour trading volumes (Volume 24h) for the eight dominant cryptocurrencies (Bitcoin, Ethereum, Bitcoin Cash, Ripple, Litecoin, Stellar, EOS, and Cardano) equaled $9.3 billion by the end of last week (Table 1.5.b), i.e. 3.8% of their market capitalization, which attests to the gradual resumption of activity on cryptoexchanges. The ZAK-4 Crypto and ZAK-8 Crypto indices are considered in more detail in Tables 1.5.a and 1.5.b.
Table 1.5.b. Daily ZAK-8 Crypto index calculation (continuation of Table 1.5.а)
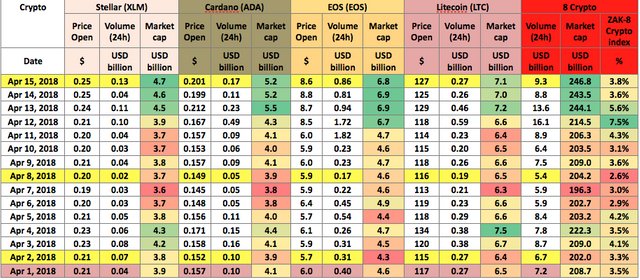
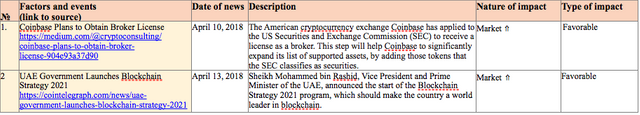
Table 1.6 gives a list of events, information on which appeared last week, which could impact both the prices of specific cryptocurrencies and the market in general.
Table 1.6. Events that could have an influence on cryptocurrency prices in the future
1.2. Market trends
The weekly cryptocurrency and digital asset market trends from December 31, 2017, to April 15, 2018, are presented as graphs (Fig. 1.1-1.5)*.
Table 1.7. Legends and descriptions of the graphs

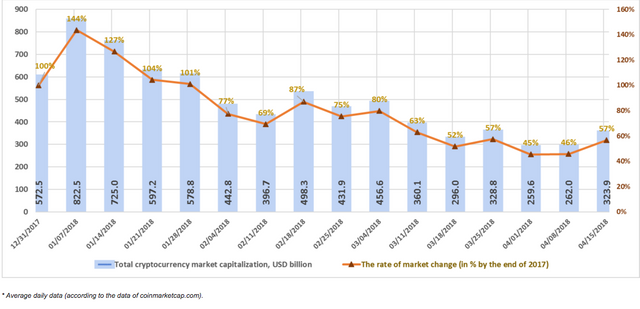
Figure 1.1. Total cryptocurrency market capitalization
Figure 1.1 shows a graph of the weekly cryptocurrency market change from December 31, 2017, to April 15, 2018. Over this period, market capitalization dropped from $572.5 billion to $323.9 billion, i.e. by 57%. Last week (April 9-15, 2018) cryptocurrency market capitalization increased from $262 billion to $323.9 billion (as of April 15, 2018, based on the average figures from coinmarketcap.com).
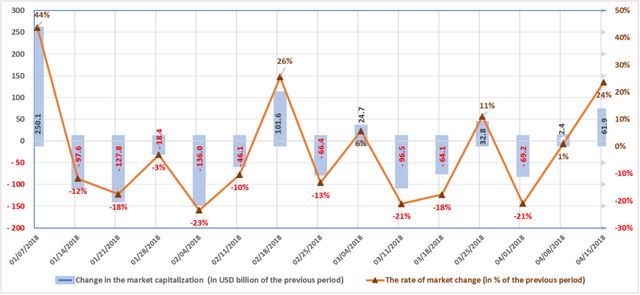
Figure 1.2. Change in market capitalization
The market is susceptible to sudden and drastic fluctuations. During the first week of January, market capitalization increased by approximately $250 billion, or 44%. The largest weekly fall in the first quarter of 2018 equaled $136 billion, or 23%, during the week of January 28-February 4, 2018.
Nine of the thirteen weeks in the first quarter of 2018 were “in the red”, i.e. capitalization fell based on the results of each of these weeks. The market has grown over the past two weeks, including by $61.9 billion, or 24%, last week (with due account of average daily data, see fig. 1.2).

Figure 1.3. Number of cryptocurrencies and digital assets
Since December 31, 2017, the total number of cryptocurrencies and digital assets considered when calculating market capitalization has increased from 1,335 to 1,538. Their number increased by 7 from 1,531 to 1,538 over the past week, and average capitalization equaled $210.6 million. Over the past month, 43 new coins and tokens have appeared on coinmarketcap.com, but it should be noted that a number of other coins and tokens were also excluded from the list.
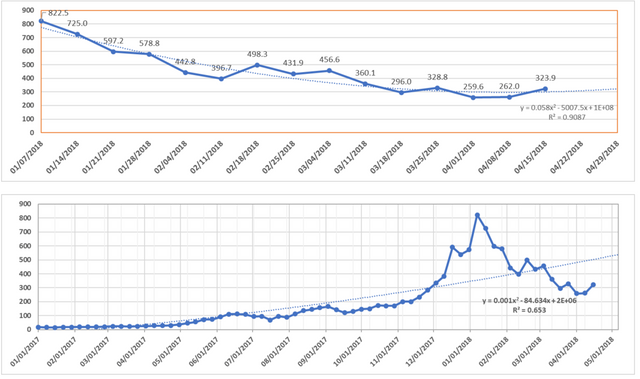
Figures 1.4 and 1.5. Forecast of total cryptocurrency market capitalization
The process of regulation of cryptocurrencies and ICOs continues to worry millions of traders and token holders. State regulatory policy is being partially adapted based on public demand and is conducted with due account of identified legal violations.
Last week saw the latest hack of a cryptoexchange. According to the information of Coinstaker, this time the target of the hacker attack was one of the most well-known Indian cryptoexchanges Coinsecure (cryptocurrency worth $3.5 million was stolen). The Reserve Bank of India issued strict rules for the exchange, use and development of virtual currencies. A number of exchanges, including BTCXIndia and ETHEXIndia, were forced to shut down trading operations due to increased pressure from the government.
The state regulatory policy in Japan and the USA is also becoming stricter, due to identified cases of theft of financial funds from cryptoexchanges. In particular, in March the FSA (Financial Services Agency) decided to suspend the work of two cryptocurrency exchanges, FSHO and Bit Station, as a result of audits of cryptocurrency exchanges carried out after the hack of the Coincheck exchange. The regulator also compelled six exchanges to improve their security systems.
A possible sharp increase in regulatory measures is possible in Vietnam due to the events surrounding the lack of payments to investors by the company Modern Tech (according to the information of cointelegraph the payments total around $658 million).
Meanwhile, Switzerland, a country with a large concentration of major banks, is steadily becoming a leader in tolerant International regulation of ICO processes and the use of the main cryptocurrencies.
The government of Malta is also actively creating a supportive legal and technical framework to promote exchange trading and positions itself as the “Island of Blockchain” that is geared toward the digital economy and cryptocurrencies.
The popularity of cryptocurrencies in South Korea is expressed in the active position of the country’s citizens. Last year a petition was filed with the government on overturning the ban on trading in cryptocurrencies in the country, and last week citizens submitted a request on the organization in the country of a “free city,” a zone unencumbered by regulation of cryptocurrencies and blockchain.
As a result, capital, technology and companies are gradually migrating to the countries with friendly laws and conditions for the functioning of the crypto industry.
ICO Market Analysis (April 9-15, 2018)
1. General analysis of the ICO market (by week, month)
1.1. Brief overview of ICO market trends
1. General analysis of the ICO market (by week, month)
1.1. Brief overview of ICO market trends
Table 1.1. Brief ICO market overview, key events, news for the week of April 9-15, 2018
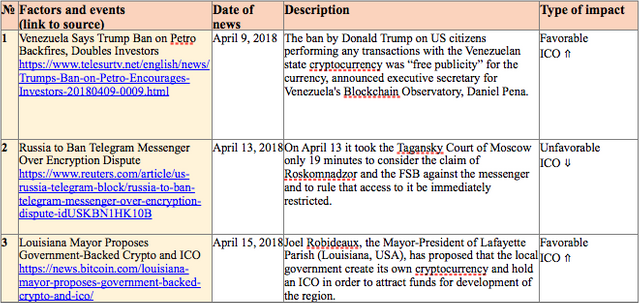
Table 1.2 shows the development trends on the ICO market since the beginning of 2018. Only popular and/or successfully completed ICOs (i.e. ICOs which managed to collect the minimum declared amount of funds) and/or ICOs listed on exchanges were considered.
Table 1.2. Aggregated trends and performance indicators of past (completed) ICOs1,2
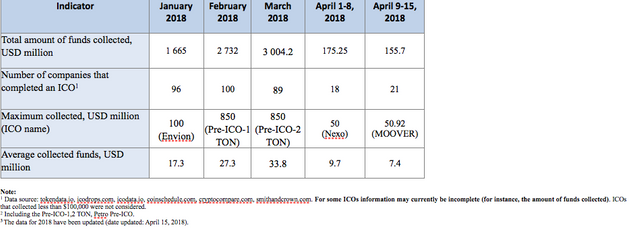
The data for the previous period (April 1-8, 2018) have been adjusted to account for the appearance of more complete information on past ICOs. Last week (April 9-15, 2018) the amount of funds collected via ICOs equaled $155.7 million. This amount consists of the results of 21 successfully completed ICOs, with the largest amount of funds collected equaling $50.92 million (MOOVER project). The average collected funds per ICO project equaled 7.4 million (see Tables 1.2, 1.3).
Table 1.3. Amount of funds collected and number of ICOs
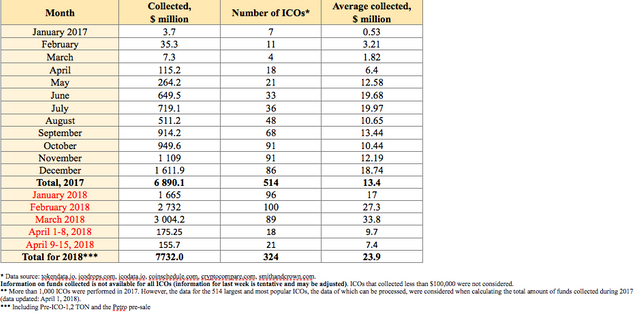
Table 1.3 shows that the largest amount of funds was collected via ICOs in March 2018, mainly due to the appearance of major ICOs. The highest average collected funds per ICO was also seen in March 2018.
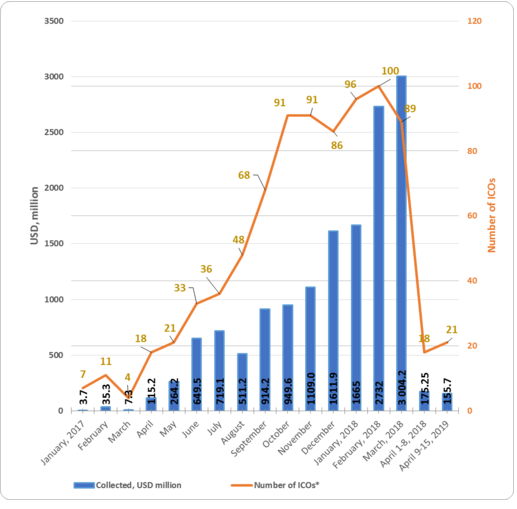
Figure 1.1. Trends in funds collected and number of ICOs since the start of 2017
1.2. Top ICOs of last week
Table 1.4 shows the ten largest ICOs of the week.
Table 1.4. Top 10 ICOs in terms of the amount of funds collected (April 9-15, 2018)
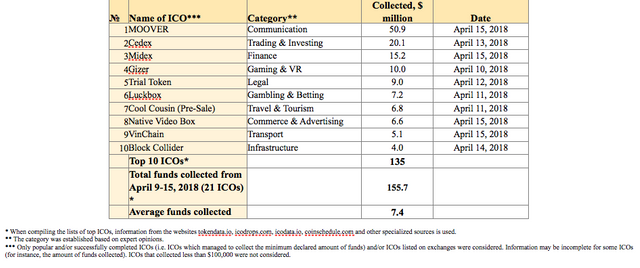
The data for past periods (April 9-15, 2018) may be adjusted as information on the amounts of collected funds by completed ICOs is finalized.
The leader of the week was the MOOVER project. This is a protocol that allows mobile users to share (sell or buy) excess mobile data outside the confines of the contract-based communications operators. It represents a new exchange economy that will give value to surplus resources. MOOVER performs the exchange of mobile data in a P2P network, encrypted using blockchain technology. This makes it possible for the system to work autonomously without centralized control. It is an inexpensive platform where third parties who do not know one another (all participating users) can safely communicate with one another while maintaining their anonymity.
Figure 1.2 presents the ten largest ICOs completed during the past week.
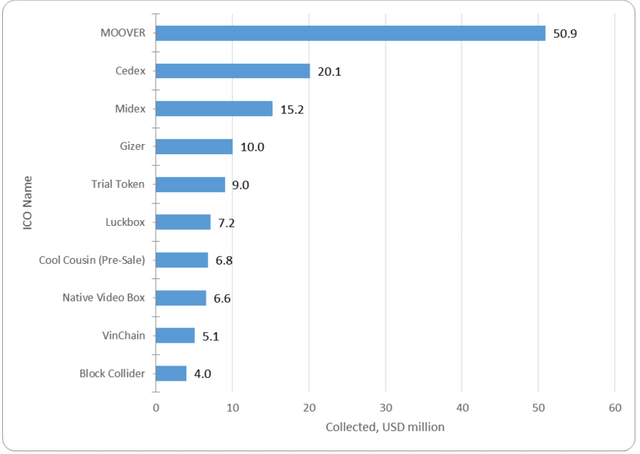
Figure 1.2. Top 10 ICOs in terms of the amount of funds collected (April 9-15, 2018)
1.3. Top ICOs in their categories
The list of top ICOs by category is compiled with due account of the categories of the leading ICOs for the week.
Table 1.5. Top 10 ICOs in terms of the amount of funds collected, Communications category
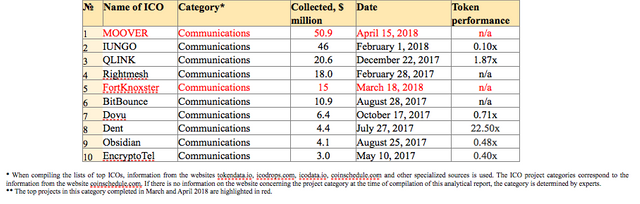
The MOOVER project was the leader of the week and the leader of the Communications category. At present, all projects from the top 10 in this category have a token performance indicator of 0.1x to 22.5x. The Dent project can be considered one of the most successful exchange listings, as this project has a current token price to token sale price ratio of 22.5x. When considering this indicator, it is important to remember that the Dent ICO was completed on July 27, 2017, i.e. the 22.5x growth took place over approximately eight months. The market capitalization of Dent currently exceeds $105 million.
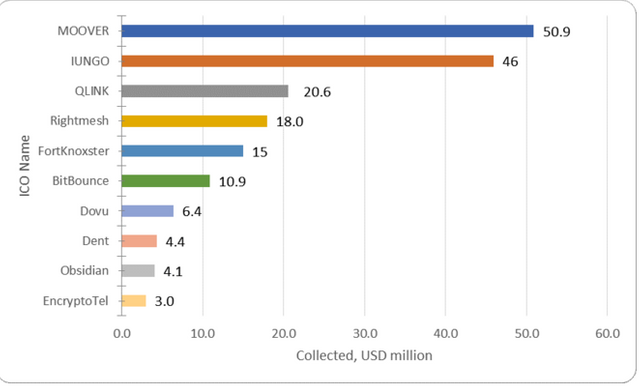
Figure 1.3. Top 10 ICOs in terms of the amount of funds collected, Communications category
The Cedex, Midex, and Gizer ICO projects, which can be assigned to the Trading & Investing, Finance, and Gaming & VR categories, respectively, were also completed last week. These projects did not make it into the top 10 of the corresponding categories (Tables 1.6, 1.7).
Table 1.6. Top 10 ICOs in terms of the amount of funds collected, Trading & Investing category
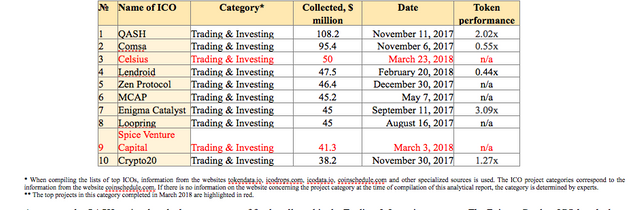
At present, the QASH project has the largest amount of funds collected in the Trading & Investing category. The Enigma Catalyst ICO has the best token performance indicator among the top 10 projects. Its market capitalization currently exceeds $135 million.

Figure 1.4. Top 10 ICOs in terms of the amount of funds collected, Trading & Investing category
Table 1.7. Top 10 ICOs in terms of the amount of funds collected, Gaming & VR category
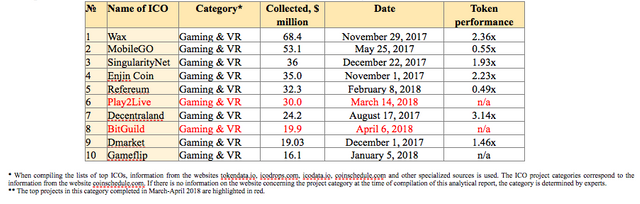
Most of the projects in this category have a token performance indicator of more than 1. The Decentraland project has the best token performance indicator. Its market capitalization currently exceeds $93 million, and its token performance indicator equals 3.14x.
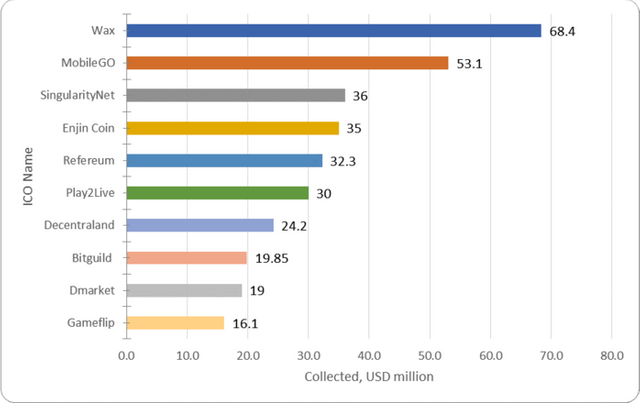
Figure 1.5. Top 10 ICOs in terms of the amount of funds collected, Gaming & VR category
During the analyzed period (April 9-15, 2018) at least 21 ICO projects were successfully completed, each of which collected more than $100,000, with the total amount of funds collected exceeding $155 million. Last week’s leader was the MOOVER project, which collected $50.9 million. The total amount of funds collected by a number of ICOs failed to reach even $100,000 (the information for some projects is still being finalized).
The Glossary is given in the Annex.
Annex
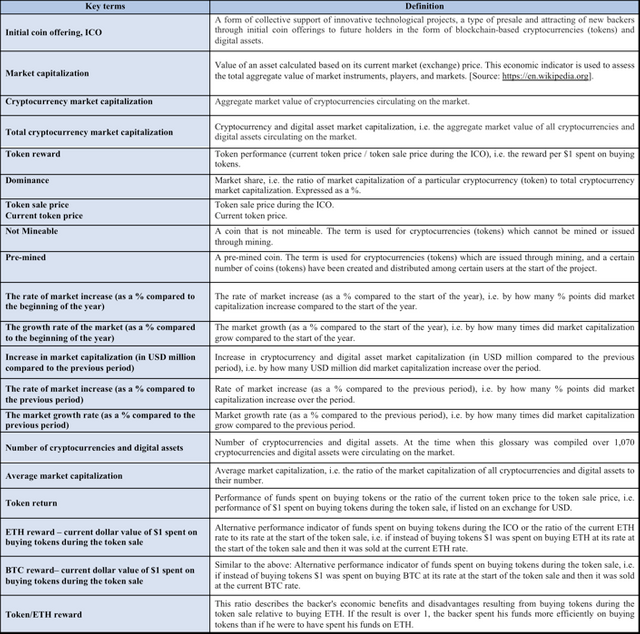
Glossary