You are viewing a single comment's thread from:
RE: I'm not sure what to do during these dark times in the market?
People that invest with knowledge is jumping out, governament rules and exchanges been banned. I think most of the fall is because of that
Any ideas of what a bottom might look like... price wise?
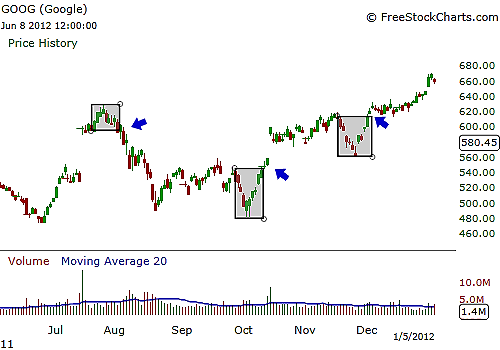
Since prices seem to blow through resistance lines without contempt, I was looking for some indicator of trend reversal. I came across the “sushi roll”. It is an engulfing pattern, but instead of two candles it contains 10 candles.

Essentially, once the latest 5 candles (say on the daily chart) engulf the previous 5, you have a reversal.
Look at the last reversals, it works.
If this is what we are waiting for, we have some waiting to do…
October time-frame?
My guess is that we get there way sooner.
I'll be waiting... with a smile on my face!
Hahaha you and the entire Steemit gaha
Ha ha, too true Sir... too true.