Comparison of returns by Market Capitalization, and How Small cryptocurrencies are beating the market
Summary
2017 has been for many investors the year of cryptocurrency. Even though the general trend has been extremely positive and returns have been astronomical, there are significant differences in performance among cryptocurrencies. In this article, I will provide an analytical overview of how the currencies have behaved during 2017 by market capitalization, which may bring some light on how to easily allocate capital looking into the future.
For the analysis, I separated groups of cryptocurrencies ordered by market capitalization and tracked their behavior over a month. The groups taken into account are: Bitcoin, 2-10, 11-50, 51-200, 201-500, and others (smallest ones). The key findings are:
- Small cryptocurrencies had a higher return than larger ones
- Groups of cryptocurrencies on the top 200 by market capitalization, excluding Bitcoin, had a similar return and behavior m-o-m
- Bitcoin had lower standard deviation than any other group, leading to a good behavior when the market is bearish
Results on a full-year basis
On the following table has the monthly returns obtained by each group.
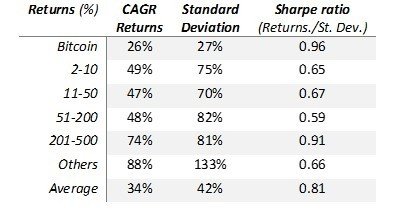
To better interpret these results, I am going to base my analysis on the monthly CAGR obtained over a year by each group and the Standard Deviation.
From these results, we can extract the following conclusions:
- Bitcoin and 201-500 segment have the highest Sharpe Ratios, 0.96 and 0.91, respectively. Even the ratios are close, the approach by which they are accomplished are opposite. While Bitcoin had the lowest return it also had the lowest standard deviation, which made it the safest investment. Contrary, the group of currencies at 201-500 of market cap. had a 91% return m-o-m, but also an extreme standard deviation. This shows us two possible strategies for different types of investors:
- One strategy would be optimal for an investor with the opportunity to allocate significant capital into cryptocurrencies but low tolerance to risk, this would lead to investing in Bitcoin,
- A second strategy could be for a low capital but high-risk tolerance investor, which would be better investing in low market cap currencies
- The group “Others” which groups the smallest available cryptocurrencies have the highest return (88% month over month)
- Currencies on the groups of 2-10, 11-50, and 51-200, had very similar results between them, yielding a CAGR between [48%, 49%] and a standard deviation between [70%, 80%]
- An investor looking for an average market behavior (index fund of the hole market) and limited availability to analyze the market, could allocate 50% of its portfolio into Bitcoin and 50% on the other top10 Cryptocurrencies of each month. This would have yielded a 37% return m-o-m and a limited standard deviation (44%)
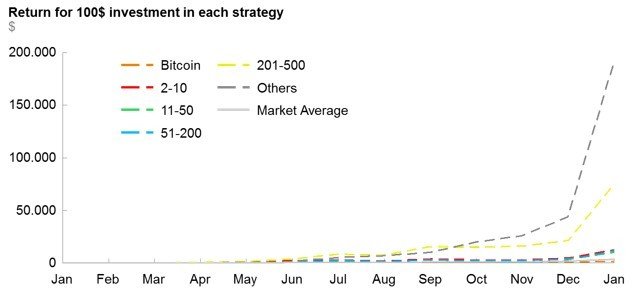
The following graph shows the cumulative return on an investment of $100 at the beginning of 2017 (each month represents the value at the end of that month). Over the $100 investment, the group of the smallest cryptocurrencies generated $191,000, the segment of 201-500 generated $75,000, and Bitcoin returned $1,530.
Same graph excluding 201-500 and Others, to better appreciate the differences and similarities on the other groups. We can see that excluding Bitcoin all the other groups had a very close behavior.
Results on a half-year basis (from July 2017 onwards)
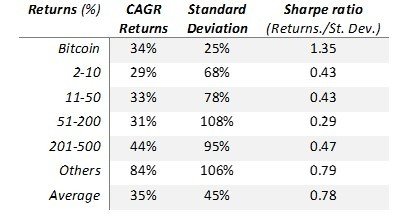
I also want to take into account that the first half of the year the market was not as developed as the second half. For this, I proceed with the same analysis but only taking into account the last 6 months.
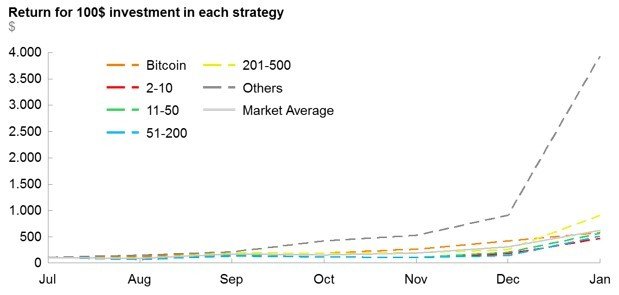
- Again, we obtain the highest returns on small currencies. In this case, the 201-500 group’s Sharpe ratio falls due its lower return (from 74% to 44%)
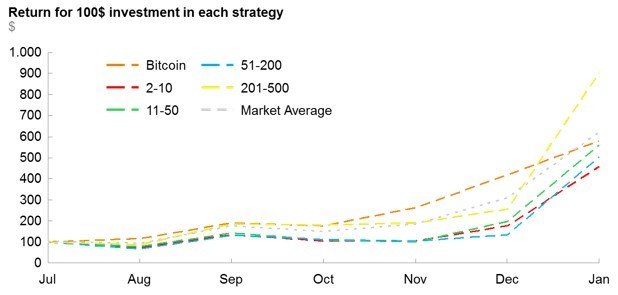
- Bitcoin had a great performance both in terms of Standard Deviation and in Returns (surpassing the group of 2-10 in market cap.), obtaining the greatest Sharpe ratio
- The rest of groups still have a similar behavior between them, but their general performance is lower
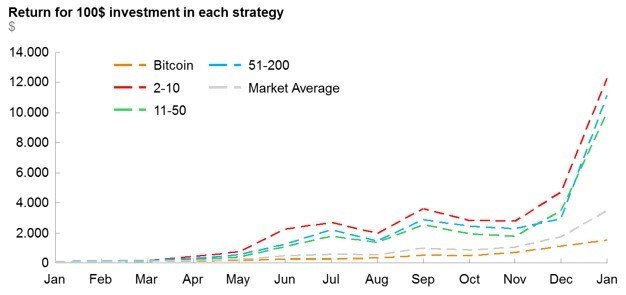
On the graph, we can see the cumulative return on an investment of $100 in July 2017. The behavior of all Cryptocurrencies is similar at the end of the period, but we can better appreciate monthly differences on the returns of each group. Bitcoin outperformed all shown groups until December, where Altcoins have rallied.
Same graph excluding the group of the smallest cryptocurrencies.
Conclusion
Even most media are focusing their attention on Bitcoin, the highest returns of the market have been, by large, in the smallest market capitalization segment (others). Even in times of general market decline, they show good resilience and behavior.
Analytical approach
For the analysis, I took into account the market capitalization of each cryptocurrency to group them and track their performance during a single month. Each month they are regrouped depending on their position at the start of the month. Allocation of capital to each currency is proportional to market capitalization at the beginning of the month. ICOs during the month have not been taken into account for that month.
Data source

Hi Eduard @etwart, thanks for this great article! I've been learning about these digital currencies for last month, and this article was one of the most interesting ones! Great job!
Thanks! hope it helps to navigate this weird 2018 that we have in front of us. good luck!