BELIEVE or NOT to BELIEVE
copyright NHS Derbyshire Healthcare (source)
Coin of coins Bitcoin is coming to a decision point in the 'science' of technical analyses.
12 months chart shows us the decision point is very near. Although, if we would be very precise, the value came down of the lower resistance line "B" and may have broken it.
6 months chart: line C and D shows us a nearby decision point as well.
4 months view: the charts - line E and D - also gives us a decision point, however we still have some time to go.
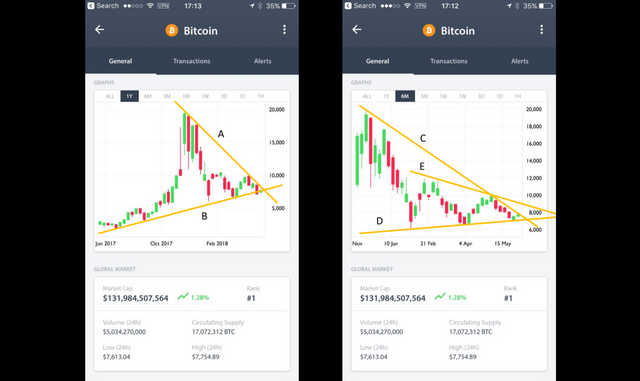
image by @edje | Bitcoin US$ values - 12 & 6 months
What happens at the decision point?
All uncertainties: Did we draw the lines correctly? When so, what lines do we believe in?
Technical analyses may direct you in a direction; But is it?
My view: At any point in time the direction of the value of an asset can go any way.
Technical Analysts view: Elliott Wave analyses is a method that can predict a breakout of an asset; Counting of the Waves shall be done correct though.
But what is correct counting?
Applying such methods to historical graphs, we generally get this "owww yes" effect. But looking into the future, anything can influence the direction. What if some time after predicting the value of the asset goes up, someone brings some important negative news? People will start selling, selling and selling - certainly in crypto space - instead of buying. It may take weeks, or months, or longer to crawl up again. However, the theory is that Elliott Waves encompasses these sudden events and market/news influences.
I didn't use the Elliott Waves in the diagrams above; I simply used the triangle method. With such method - as far as I understand - decision points can be determined. At such decision point, either the value of the asset goes down, or up. I would add sideways direction to up or down. But I seem to be able to draw different triangles; So which to choose?
This brings us to the following conclusion:
At any point in time the value of an asset can go somewhere between sudden large increase, to no change, to sudden large decrease. In short: it can go any way at any time.
What Do You Believe In?
Music Library with more than 200 Entries
That we might as well toss a coin. Or ask my 90 year old grandma. Or use twister and if it gets green then the price will go up. Red is down. Blue and yellow means it will be a surprise.
I used my twister method 8 times and I only got blue and yellow 😬🤨
:)
why come out and finish
Thats true and you have given both perspectives. Elliott wave and triangle method both are adopted widely. Though sometimes nothing follows it, thats what makes the volatile nature of crypto and truth is that it is also the reason we are trading. I think bitcoin would go up as the adoption would increase. But, none the less with every new ICO it can go down :)
Up, Down, Sideways... everytime the same possibilities :)
haha thats true :) but, i need to be very careful from now on. I was a bad trader
Me too :)
Hi @edje, it seems you are really interested in bitcoin! Maybe it would be interesting for you to check out my bitcoin t-shirt design here:

https://teespring.com/bit-to-the-moon
Thanks for your attention and have a great day!