Price Analysis: BCH / USD (Coinbase)
Summary:
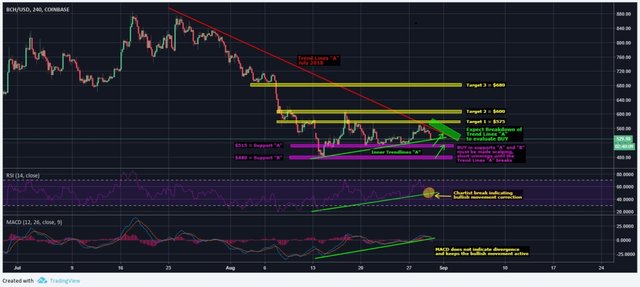
Bitcoin Cash (BCH), comes in a strong correction by visiting again the area of the Inner trendlines “A”, taking into account the following supports I recommend the following …
Investment:
For the graphic in the frame H4
The best buy with a higher probability of going up is to wait for the break of Trend Lines “A” of July 2018, since it comes very well and the bounce was perfect on August 28, 2018.
If we get that break the recommended targets are the following …
Target 1 = $ 575

Target 2 = $ 600

Target 3 = $ 680

Stop Limit = Calculate at 3% or 4% as Maximum from the point of BUY
In the case of losing the Inner Trendlines “A”, I recommend waiting for the price drop back to the supports plus amounts identified in the “A” and “B” graphs ($ 515 and $ 480).
At this level, Scalping type purchases with quick profit takes between 2% to 4% should be evaluated.
The RSI indicator in this frame identifies a breakout of its uptrend chartist, for this reason we are validly seeing a big setback, which will resume when it gets flat again and that can be at the levels of the inner TrendLines “A” or the brackets indicated “A” and “B”.
The MACD indicator remains valid in an uptrend, this gives us a probability that the price respects the Inner Trend Lines “A” and seeks again to attack the Trend Lines “A”.