R programming for quantitative investment: part 1 - fetch market data from web
Fetch crypto price chart data from web and analyze data with Excel, R and other programs
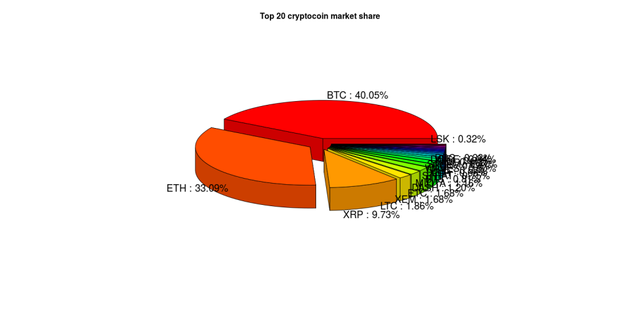
In this post we'll learn to use R to "read" web data and, as an illustrative application, use the data to plot a simple pie chart. I have been writing about a secure trading platform first before writing about trading strategies themselves. Instead of writing an intro-to-R type of post, I actually wanted to start with an application so the usefulness for the language is better realized. R users might find the post trivial; we'll soon write about advanced forecasting strategies with R's Finance and Time Series Analysis packages and other advanced techniques. Most important, we need data to conduct any kind of analysis. Here we'll learn to collect web data. For beginners, well, I guess to be able to plot - just with a few key strokes - with, say, R pietop20.R command, the below pie chart of percent of market share of top 20 (or any number) currencies should be enough motivation to learn R. I'm new to R - I will write as I learn. Suggestions and recommendations are much appreciated.
It looks cool, right? We can plot not only cool but also useful plots. If you don't understand the code now, just get along and get the concept. We'll talk about specific commands in other posts. I will leave links to resources I found helpful. If you don't want to install R, use SageMath online R console. So let's do it...
We'll "read" CryptoCurrency Market Capitalizations (CMC) price chart from their website and then analyze the data: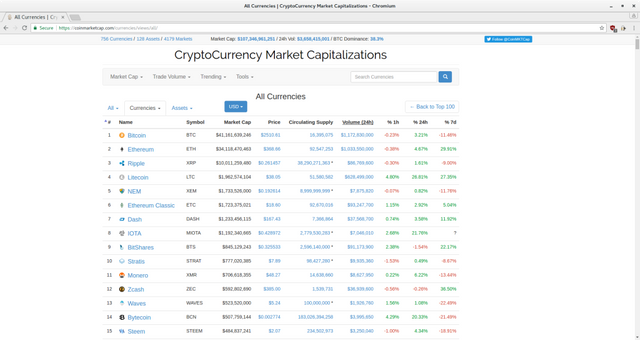
First load two R packages, rvest and plotrix. url_cmc is CMC price chart URL. In the code, texts entered after # are comments and ignored by R.
R> url_cmc <- "https://coinmarketcap.com/currencies/views/all/"
R> library(rvest) # library() command loads <rvest>, a package to read web data
R> library(plotrix) # plotting utility
R> library(dplyr) # package for data manipulation
Now do the actual reading:
R> url_cmc %>%
  read_html() %>%
  html_nodes(css = "table") %>%
  html_table() %>%
  as.data.frame() -> "tbl_cmc"
The above code snippet "reads" crypto price chart and stores it to the variable named tbl_cmc.
Let's see what our program fetched by issuing head(tbl_cmc) command:
R> head(tbl_cmc)
  X.             Name Symbol      Market.Cap     Price                                                                    Circulating.Supply   Volume..24h.  X..1h X..24h   X..7d
1  1          Bitcoin    BTC $40,980,536,156  $2499.56                                                                            16,395,100 $1,178,430,000 -0.84%  3.01% -11.84%
2  2         Ethereum    ETH $33,970,070,455   $367.06                                                                            92,547,630 $1,027,180,000 -0.68%  4.76%  29.18%
3  3           Ripple    XRP  $9,939,465,221 $0.259582 38,290,271,363\n                    \n                    \n                        *    $88,358,500 -0.88%  1.18%  -9.65%
4  4         Litecoin    LTC  $1,987,981,395    $38.54                                                                            51,580,682   $654,851,000  4.10% 28.77%  28.96%
5  5              NEM    XEM  $1,731,969,000 $0.192441  8,999,999,999\n                    \n                    \n                        *     $7,839,170  0.24%  1.66% -12.02%
6  6 Ethereum Classic    ETC  $1,723,568,637    $18.60                                                                            92,670,461    $92,515,200  1.05%  3.42%   4.93%
It did fetch the table, but the table contains a few unwanted characters such as new line, \n, spaces, %. In order to conduct analysis, we need to get rid off these characters. Computers don't seem to go well with texts; they understand numbers better. I would like to remove the first column(coins' ranking from CMC - we'll create rankings based on our custom criteria), make the column names small, lowercase and meaningful. Having a look at the website should make this post's naming. Let's do...
R> tbl_cmc[] <- lapply(tbl_cmc, gsub, pattern = "\\\n|\\s|[%*$,?]", replacement = "")
R> tbl_cmc$X. <- NULL
R> names(tbl_cmc) <- c("name", "symb", "mcap", "price", "supply", "vol", "ch1h", "ch24h", "ch7d")
See how our table looks with head(tbl_cmc):
R> head(tbl_cmc)
             name symb        mcap    price      supply        vol  ch1h ch24h   ch7d
1         Bitcoin  BTC 40980536156  2499.56    16395100 1178430000 -0.84  3.01 -11.84
2        Ethereum  ETH 33970070455   367.06    92547630 1027180000 -0.68  4.76  29.18
3          Ripple  XRP  9939465221 0.259582 38290271363   88358500 -0.88  1.18  -9.65
4        Litecoin  LTC  1987981395    38.54    51580682  654851000  4.10 28.77  28.96
5             NEM  XEM  1731969000 0.192441  8999999999    7839170  0.24  1.66 -12.02
6 EthereumClassic  ETC  1723568637    18.60    92670461   92515200  1.05  3.42   4.93
Nice! We now have pretty nice looking table. Suppose, we're interested in top 100 crytocoins of total market capitalization. In order to select top 100, we can sort (descending) market capitalization, tbl_cmc$mcap. Oh, wait, can we run mathematical operations on market capitalization variable, mcap? Let's see:
R> typeof(tbl_cmc$mcap)
[1] "character"
We can't do maths on texts. Let's convert the character type to numeric:
R> num_tbl_cmc <- lapply(tbl_cmc[-c(1:2)], as.numeric) %>%
  as.data.frame()
R> tbl_clean <- cbind(tbl_cmc$name, tbl_cmc$symb, num_tbl_cmc)
R> names(tbl_clean) <- c("name", "symb", "mcap", "price", "supply", "vol", "ch1h", "ch24h", "ch7d")
Check again with typeof(tbl_clean$mcap) command:
R> typeof(tbl_clean$mcap)
[1] "double"
double is a floating point data type in R (and all other languages) on which mathematical operations are valid. So let's select top 100 crypto by market capitalization and store the table in variable named top_100_mcap:
R> top_100_mcap <- arrange(.data = tbl_clean, desc(mcap))[1:100, ]
Now we might be interested to know how much the total of top 100 crypto market caps add up to. Well, do:
R> sum(top_100_mcap$mcap)
[1] 102587923261
So top 100 crypto add up to $102.588bn. Well, what percentage does BTC or ETH have of that total market cap? Fine, why not calculate market share percentage for all 100 currencies? We create mcap_prcnt variable where mcap_prcnt [i] = mcap[i] / sum(mcap). Based on the percentage data, we then plot a pie chart for top 20 coins by market cap:
R> top_100_mcap$mcap_prcnt <- top_100_mcap$mcap/sum(top_100_mcap$mcap)
R> top_20_mcap <- arrange(.data = top_100_mcap, desc(mcap))[1:20, ]
R> lbls <- paste0(top_20_mcap$symb, " : ", sprintf("%.2f", top_20_mcap$mcap_prcnt*100), "%")
R> pie3D(top_20_mcap$mcap_prcnt, labels = lbls,
      explode=0.1, main="Top 20 cryptocoin market share")
This final code snippet generates the plot we saw at the beginning. Now let's say, we'd like to see which currency appreciated the most in last hour, then we order again by 24h growth and yet again by 7d.
R> perf <- arrange(.data = top_100_mcap, desc(ch1h), desc(ch24h), desc(ch7d))
R> head(perf, 10) # Display first 10 rows.
         name symb       mcap     price       supply       vol ch1h  ch24h   ch7d    mcap_prcnt
1      YbCoin  YBC   26007845  8.610000      3020284   1993660 9.72   8.37  10.94 0.00025351761
2   RaiBlocks  XRB    9986317  0.123589     80802633    338412 5.27 102.76 228.80 0.00009734398
3  FedoraCoin TIPS   12712811  0.000029 443168182458     90087 4.92   4.06   3.27 0.00012392113
4   MergeCoin  MGC   13760828  0.137585    100016920   1534390 4.11   5.14  15.53 0.00013413692
5    Litecoin  LTC 1987981395 38.540000     51580682 654851000 4.10  28.77  28.96 0.01937831795
6      Factom  FCT  251642792 28.750000      8753219   5173240 3.88  10.91  -4.70 0.00245294752
7     Skycoin  SKY   16202383  2.920000      5550301     44569 3.85  66.17  57.63 0.00015793655
8       Quark  QRK   11749172  0.046978    250101047    969738 2.93  -0.70 113.38 0.00011452783
9   BitShares  BTS  844080402  0.325129   2596140000  90839500 2.46  -0.67  21.76 0.00822787298
10  XtraBYtes  XBY   18078125  0.027813    650000000    123797 2.44  12.53   5.78 0.00017622079
We see, YbCoin (YBC), grew the most, by 9.72% 8.37% and 10.94% in the last hour, last 24 hours and last week. It'd have been nice to know how a currency, BTC or ETH, for example, is performing compared to the market, right? Or suppose we've a portfolio of BTC, ETH, ETC, XMR, DASH, SC, IOTA and ZEC. Wouldn't it be nice to know how our entire portfolio is performing relative to the entire crypto market? We'll see some more examples in next posts. Stay networked! Keep Steeming!
Code
This is the code that generates our intended plot. It takes less than a quarter-minute to read web chart and generate the plot with realtime market data. Save the script, for example, as pietop20.R, and run from terminal with R pietop20.R command to get the realtime market pie chart. In R console, run install.packages(package-name) to install package <package-name>.
# Load required packages and find price table URL
url_cmc <- "https://coinmarketcap.com/currencies/views/all/"
library(rvest) # for data fetching
library(plotrix) # for 3Dplot
library(dplyr) # for data manipulation

# Read the price table
url_cmc %>%
  read_html() %>%
  html_nodes(css = "table") %>%
  html_table() %>%
  as.data.frame() -> "tbl_cmc" # save table to variable <tbl_cmc>


# Clean data
tbl_cmc[] <- lapply(tbl_cmc, gsub, pattern = "\\\n|\\s|[%*$,?]", replacement = "")
tbl_cmc$X. <- NULL
names(tbl_cmc) <- c("name", "symb", "mcap", "price", "supply", "vol", "ch1h", "ch24h", "ch7d")

# Prepare data for mathematical operations
num_tbl_cmc <- lapply(tbl_cmc[-c(1:2)], as.numeric) %>%
  as.data.frame()
tbl_clean <- cbind(tbl_cmc$name, tbl_cmc$symb, num_tbl_cmc)
names(tbl_clean) <- c("name", "symb", "mcap", "price", "supply", "vol", "ch1h", "ch24h", "ch7d")

# Select top 100 by market cap
top_100_mcap <- arrange(.data = tbl_clean, desc(mcap))[1:100, ]
# Add a column named <mcap_prcnt> which percentage of a crypto assets market share
top_100_mcap$mcap_prcnt <- top_100_mcap$mcap/sum(top_100_mcap$mcap)


# 1h growth, highest, then 2h highest and 7d
perf <- arrange(.data = top_100_mcap, desc(ch1h), desc(ch24h), desc(ch7d))
head(perf, 10) # Display first 10 rows

sum(top_100_mcap$mcap) # coin market cap, aggregate

# Top 20
top_20_mcap <- arrange(.data = top_100_mcap, desc(mcap))[1:20, ]

# Actual plot
lbls <- paste0(top_20_mcap$symb, " : ", # Create labels for plot
               sprintf("%.2f", top_20_mcap$mcap_prcnt*100), "%")
pie3D(top_20_mcap$mcap_prcnt, labels = lbls,
      explode=0.1, main="Top 20 cryptocoin market share")


# Export collected data to Excel, SPSS, etc. `table_clean` variable contians data on 756 coins in analyzable format.
# We export the whole data set:
# for Excel
R> library(xlsx)
R> write.xlsx(tbl_clean, "clean_chart.xlsx")

# SPSS
R> library(foreign) # for SPSS and more including Excel
R> write.foreign(tbl_clean, "clean_chart.txt", "clean_chart.sps",   package="SPSS")
References and R resources
It should list more materials. Later.
- An Introduction to R on CRAN
- Quick-R
- package rvest by Hadley Wickham
- package plotrix
Title is a little off but this is great on topic tutorial. Thanks.
Thanks for the suggestion; tittle changed.
Wow! $92.82 from a single comment with 3 votes? How is this even possible? @eeks
When running this code:
I got this error:
Am I missing a package?
When I tried it in Rstudio it worked. Not sure why it did not in R console.
arrange()is a function indplyrpackage. Install the package by runninginstall.packages("dplyr").its old but maybe you like this
https://steemit.com/steem/@chrishronic/forecasting-steem-prices-an-econometrics-tutorial-for-anyone
something i wrote real quick long time ago. if you want to play with it you can bug me ;) best, C
I saw your post. Recommendation - formatting your code well would make it more readable.
ah well its just something I cooked up on the fly, if you have questions just bump me
"best, C"
i thought for a minute you said you wrote it in C.
hehhee
I understand R is quite powerful, but it's syntax brings me to my knees.
nonetheless quite interesting analysis.
And you wrote earlier that you thought I wrote it in C. I've to be reborn in order to accomplish this task in C. R is like human language.
Coinmarketcap has an api (Documentation here!), so you can swap out the rvest/web scraping for some jsonlite/json action if you prefer. EDIT: Ah, I see. You cover the API in part 2.
This is a brilliant series you're writing! Thanks for sharing your work in detail. Like you, I've started learning R and getting into crypto a little while back, but am still struggling to translate some of the things I want to do into code (I haven't tried anything for crypto yet, good idea!)... :(
You seem to already have a good handle of it, what resources did you use to learn?? I started off with Learning R by Richard Cotton (O'Reilly pub.) but dropped the book a while back and have been patching things together from online resources and forums. But my learning is a bit too patchy now haha. Any suggestions?
@pv-p Join the https://github.com/rfordatascience online learning community. We collaborate on #slack #R4DS channel.