How To Limit Risk And Make More Profit In Cryptocurrency Trading By Using indicators.
At the time of this post this was my second successful time using this indicator and on my recent trade I bought in with 53.60$ and now its currently worth 61.50$ but i'm going to continue to hold because it is NEO and the market is going crazy for it at this time. This indicator helps you get a better idea of where the market is going and helps you buy at the lowest point and sell at the highest point.
So first off you need to go to www.Tradingview.com and create an account and it's free but you can pay for other options but for my indicator that I am showing you it is completely free.
Once you have created your account click on the search tab and type in the Abbreviation for your coin of choice. In this example I will use Ethereum.

Then choose your desired currency pair for trading, for this example I will be doing Ethereum/Bitcoin pair. Once you do that you need to click on "Interactive Chart"

After that you need to click on the indicator tab and type in "Moving Average Exponential"

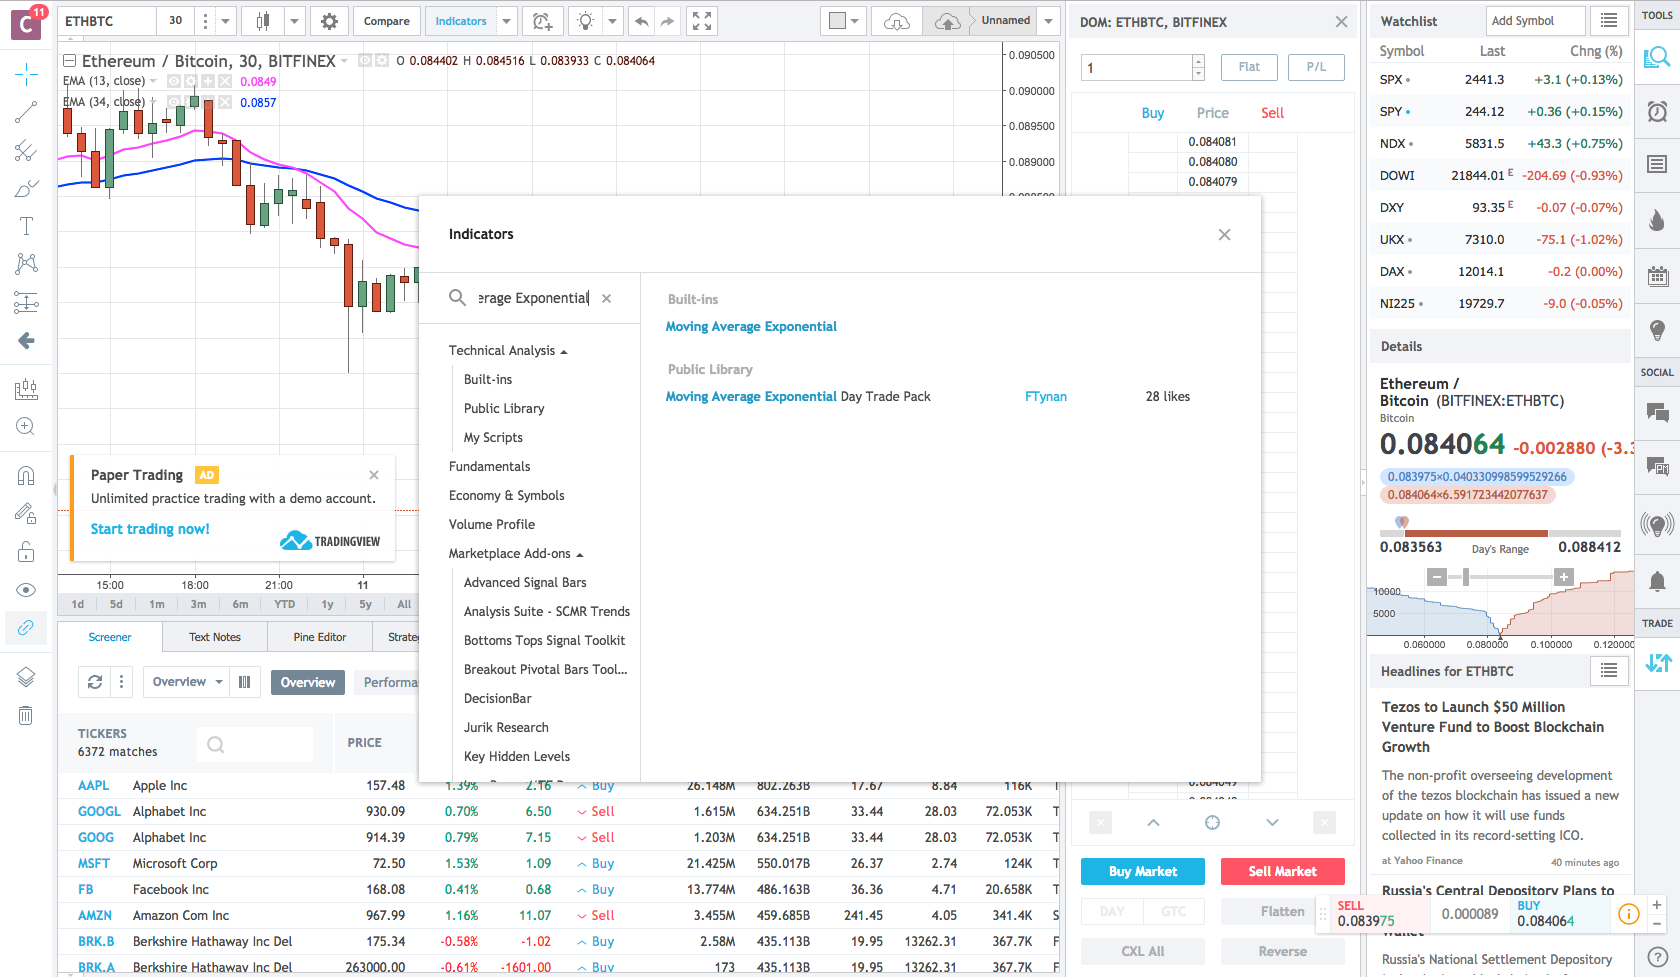
But you need to do that a second time so you get 2 lines, so basically add the indicator 2 times, then at the top left of the chart you should see these two things that begin with "EMA" and click on the gear logo on the first one and make the settings exactly how mine are.

This is for the first indicator

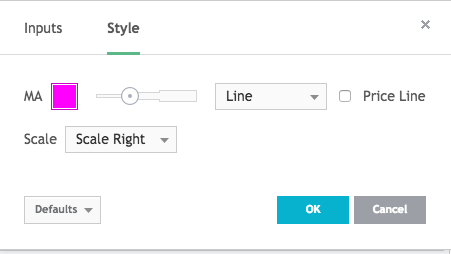
This is for the second indicator


To explain this through text I think it will be harder for someone to get the understanding of it, so i will direct you to the exact point in the video where Trevon James explains on how to read the lines to get the best buying and selling position and how the lines forcast what is coming up in the market
Start watching the video at 8:12 for Trevon to explain how to read the blue and pink line
If you had trouble setting up the indicators start watching the video from the beginning and he will show you how to do so.
Thank you for viewing this post and i hope this helps some of the newer traders out there. Steem on!
Great post.
I like to use the following:
EMA
MA
RSI
STOCHS
FIB
but the best is my gut feeling based on price action,
Once you see where money is flowing in and out it seems to be a lot more fun!
Good luck all and if you like to trade, please feel free to follow me for real time market updates.
since you are a fellow trader ill follow you
Salamat da importante nga impormasyon
Hey there!
This is a great start but i have the best results by combining an MACD with StochasticRSI to get good entry points :)
Have fun trying this out and feel free to upvote back :)
thanks for the info
Great post. This is just the kind of information I was looking for as a new soon to be trader! Followed
hope your trades go well
@cryptotraderx got you a $1.54 @minnowbooster upgoat, nice! (Image: pixabay.com)
Want a boost? Click here to read more!
Well presented thank you. I'm very interested in EOS? Have you trade it yet?