Stellar (XLMUSD) Chart Pattern Analysis: Intraday Timeframe
Analysis for Stellar (XLM) for today is carried out on a 6 hour timeframe, with price action from June 27, 2018 to current date.
The symmetrical triangle drawn on the chart lasted over 4 months before eventual confirmation and breakout of the chart pattern on November 22, 2018. Bullish price swing from ~$0.09 to $0.14 broke out of a bearish swing that lasted for about a month and is part of the move to the downside confirming the triangle.
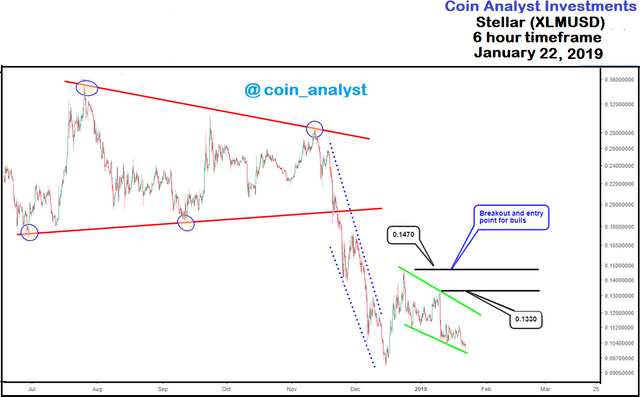
Conservative entry into a long position which also implies continuation of bullish momentum in Stellar would require a break above the current bearish channel (highlighted in green) and also price closing above ~$0.1470 which is used as the upper boundary of immediate overhead supply or resistance.
A break below the lower boundary of the bearish channel decreases the chance of continuation of the bullish price swing from the December 15, 2018 low of ~$0.09.
Interested in Ethereum analysis (ETHUSD)? Check out our previous analysis below:
https://coinanalyst.investments/2019/01/20/eth-analysis-3/
Besides, Bitcoin Analysis (BTCUSD) analysis can be found here:
https://steemit.com/bitcoin/@cryptotrader0029/bitcoin-bulls-ready-for-battle-here-s-why