Plotting Accurate Support and Resistance Levels on Tradingview
Many people have trouble determining accurate price levels for support and resistance, especially when trading on lower timeframes. By using calculated levels, one may determine appropriate stop loss and take profit levels in a consistent manner. This will allow for more accurate trading, and for the performance of a particular strategy to be evaluated with consistency.
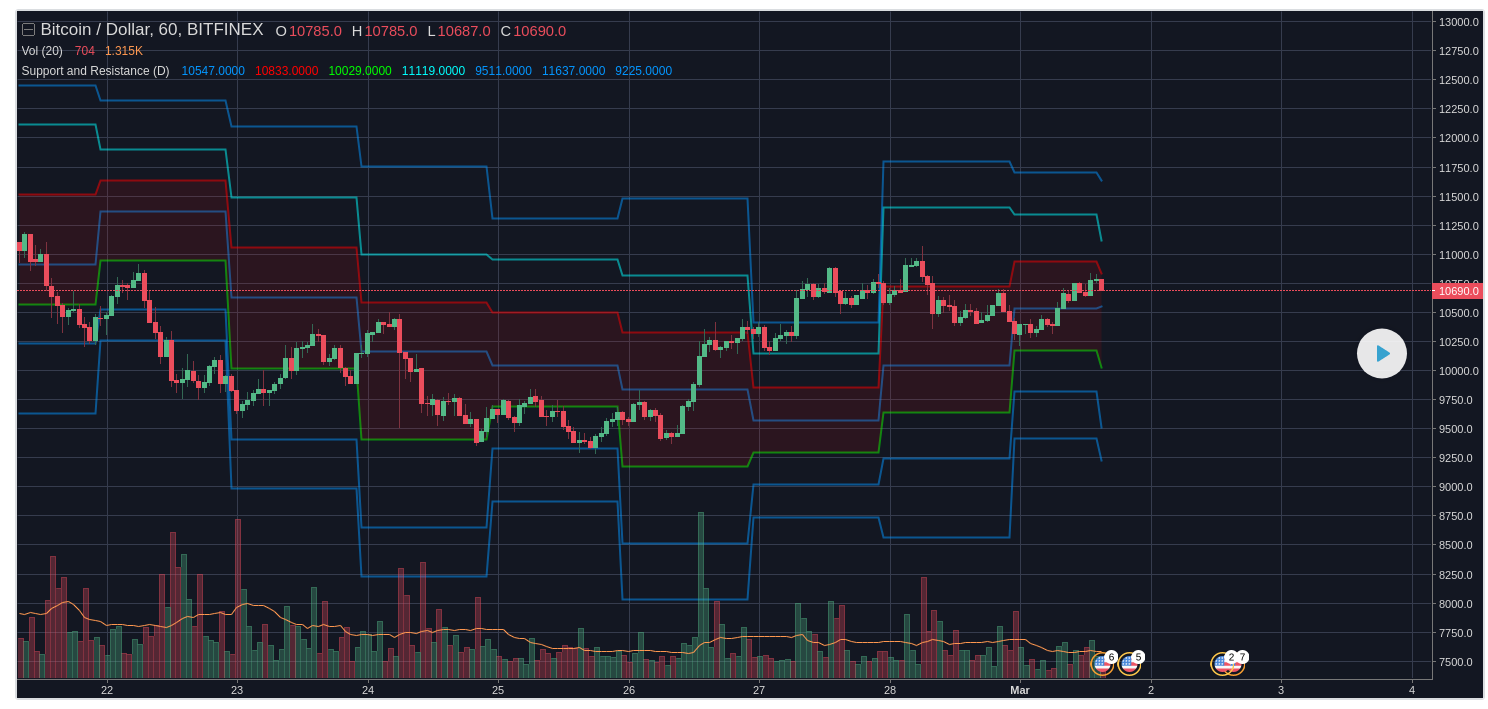
Follow this link to find the source code for this indicator. The platform is Tradingview, and the language used is Pine Script. The indicator plots support and resistance levels based on pivot points calculated from the timeframe selected. The default timeframe is daily, and this can be adjusted in the input screen of the indicator.
Here is an example of the indicator used on a BTC/USD chart:

Here is the source code:

This code can be copied and pasted from the Tradingview link at the top of the post. Enjoy! Please comment with any suggestions.
Congratulations @cryptometry! You received a personal award!
Click here to view your Board
Congratulations @cryptometry! You received a personal award!
You can view your badges on your Steem Board and compare to others on the Steem Ranking
Vote for @Steemitboard as a witness to get one more award and increased upvotes!