A Look at Market Capitalisation and Previous All-Time-Highs in the Crypto Market
Although the last couple of weeks have been somewhat of a reality check for the cryptocurrency markets, in particular the long suffering Altcoin market, Bitcoin’s leap from sub $4,000 to comfortably above $5,000 a few weeks ago got us dreaming of past All-Time-Highs.
So we thought it would be interesting to look at exactly how far we are from previous All-Time-Highs and also took a look at how these are affected by Market Capitalisation and the change in a coin’s token supply.
Below is a table of our results, using data from coinmarketcap.com, and going back to October 2017 (any coin not around then has been dropped from the study), one can immediately see just how much pain there has been since most coins hit their highs at the end of 2017. It’s interesting to see Binance Coin (BNB) is the clear winner here, and this will come as no shock to those following the markets closely as BNB has gone from strength to strength over the last few months, and in fact printed a new ATH only a couple of weeks ago.
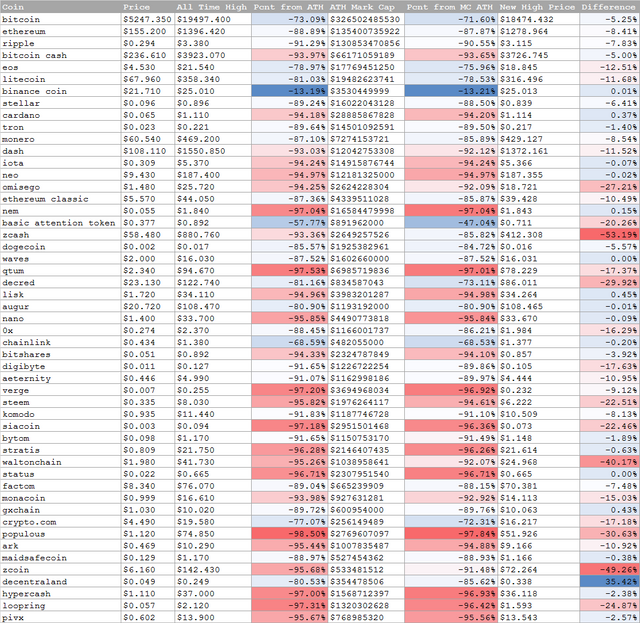
We then went on to compare each coins ATH Market Capitalisation with it’s current supply, and backed out a new ATH based on this information, and the results were somewhat surprising. For a number of coins, our new potential ATH price is in many cases quite a bit lower than the actual ATH a year or so ago.
For example, looking at Zcash (ZEC), it had it’s Market Cap ATH in January last year at $2,649,257,526, with a USD price of $880.76. Now with a current circulating supply of 6,429,231 ZEC, if Zcash were to once again print a Market Cap of $2.6 Billion, that would equate to a USD price of only $412.31, (Market Cap/Circ Sup = Price), which is just over half the USD ATH of $880. And this appears to be the case with many other coins, Zcoin (XZC) and Walton Chain (WTC) being the other two whose potential USD ATH is now significantly less than their previous ATH.
Although this is a slightly speculative way of analysing a coins ATH, and depends heavily on accurate data both from a historical point of view and now, we nonetheless thought it was interesting to see the winners and losers using this approach. This difference is explained by an increase in circulating tokens since the previous ATH, and will be due to mining (think Bitcoin) or the release of extra tokens from various phases of an ICO for example, so this isn’t to say prices can’t reach their ATH, but we thought it would be useful, if nothing else, to have this information. GL.