$PAY/BTC Technical Analysis | Crypto Trading Update 30
7 years ago in #cryptocurrency by cryptokraze (72)
$0.62
- Past Payouts $0.62, 0.00 TRX
- - Author $0.60, 0.00 TRX
- - Curators $0.02, 0.00 TRX
waiting for it to moon
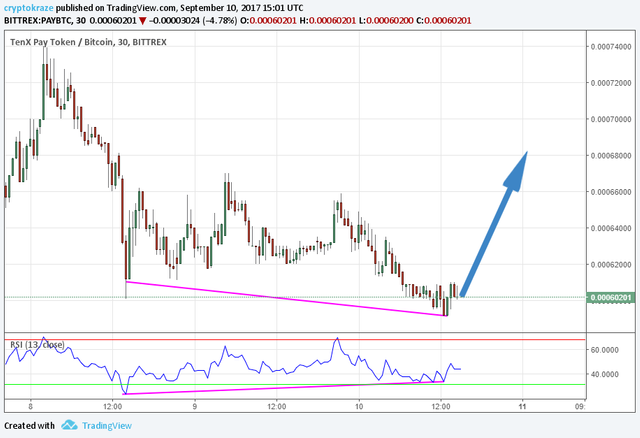
I have to point this out. There's only one line which seems like showing the current support levels. And the other one just shows the probability. I wish you could add some real analysis so that people could understand more. I can do this same thing with any given coin/token's chart and still can't call it TA.
Just search a thing called divergence.
Then you will have to apologize.
@miserableoracle
Now you can see the price has touched the level where I indicated with blue arrow.
So try to learn things instead of your miserable comments.