IOTA/BTC Technical Analysis
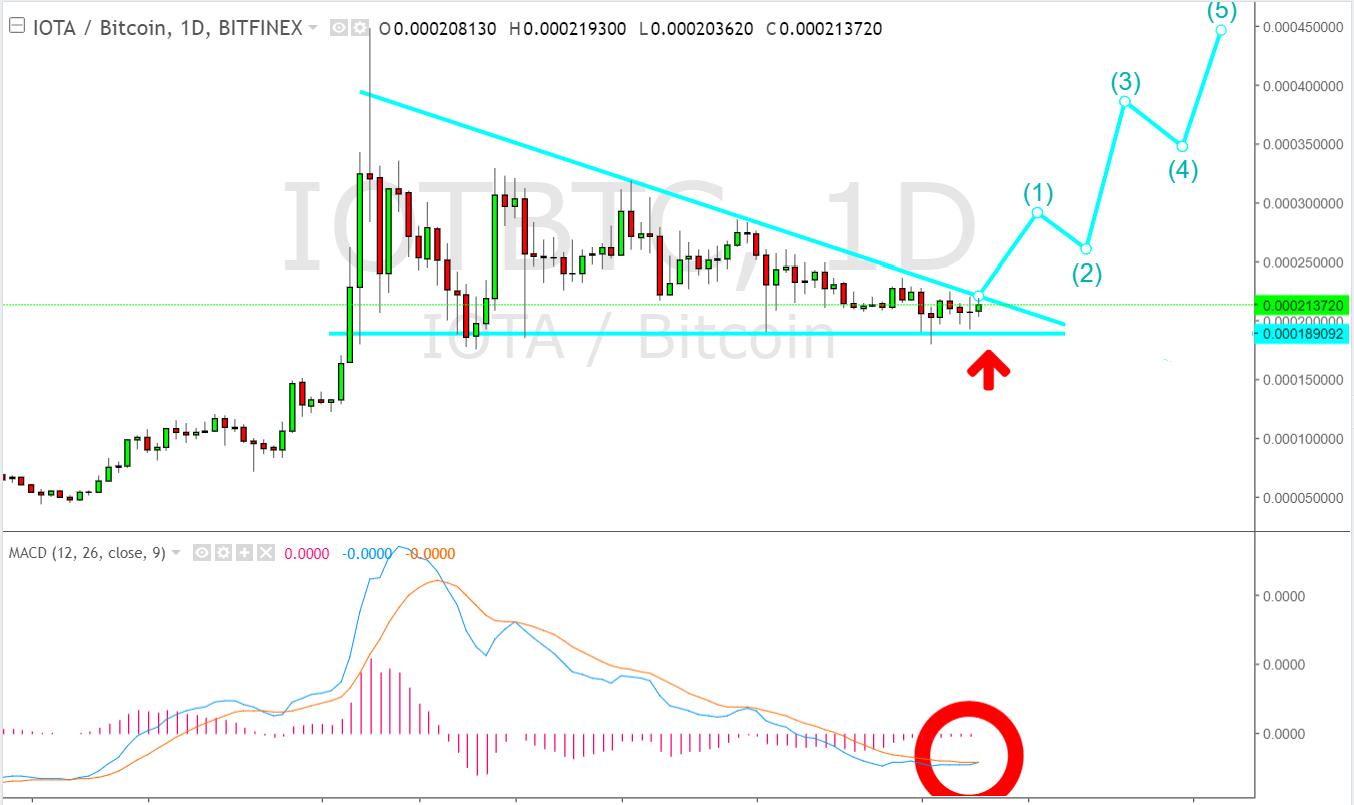
The price of IOTA / BTC has been in the triangle formation for a long time. We usually see the start of hard rising trends following triangular formations.
There are a few things that draw attention on the chart. First of all, prices are very close to both the upper and lower band. This shows that prices will be broken in any direction after a short period of time.
An important sign that the MACD indicator is supposed to signal a null below zero level.
My opinion is that prices are likely to break the upper band and We may witness the beginning of a new uptrend following prices breaking the upper band.
