BTCUSD Daily Chart update - May 28, 2018
https://www.tradingview.com/x/AXrdeHks/
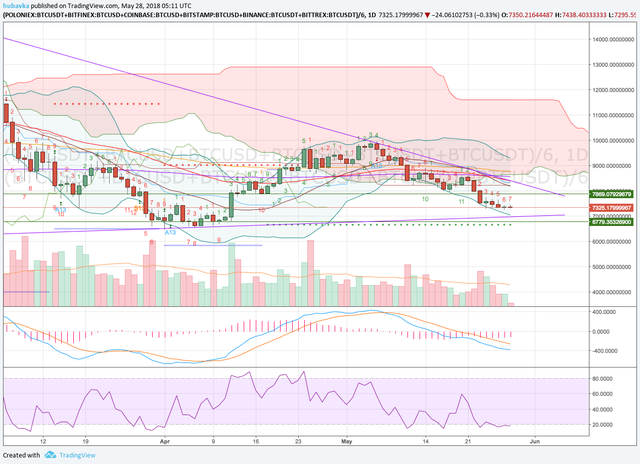
Yesterday we had a doji on daily. Price range was a lot tighter on low volume. MACD trending down and RSI staying at oversold levels. There is no sign of reversal on this time frame, but if you zoom in to the 1h and 4h charts you can see a sideways consolidation. I am currently favouring a bounce towards the 7,600-7,800 area. That said we need to see the direction when the volume returns. There is a possibility the downtrend resumes without a bounce towards 6,900-7,000 area before making some kind of a bottom on the daily chart.
Weekly: Down
Daily: Down
4 hour: Neutral
1 hour: Neutral
Prediction for the day
The sideways consolidation should end today and we will see a move of $300-400. Breakdown of $7,200 or a breakup of $7,400 should confirm the direction.
If you don't have a BitMEX account yet please use this link to register and get 10% off commissions:
https://www.bitmex.com/register/WGhKhX
Signup for the first fully decentralized ALT coin exchange:
https://www.altcoin.io?kid=KAVYG