BTCUSD Daily Chart update - May 25, 2018
https://www.tradingview.com/x/pVgS9n9D/
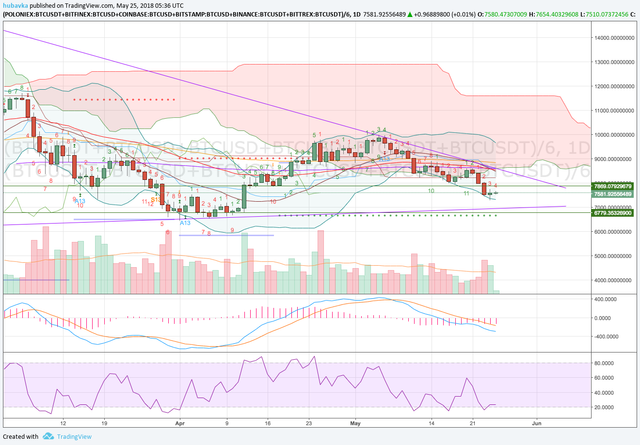
Yesterday we broke the $7,600 support and headed towards the $7,200 level. The low was $7,265, but we bounced from there back to the $7,600 area to form a doji on the daily chart. That suggest that we are in a short term correction upwards and can expect more upside today. I think the maximum upside will be limited by the $7,850-7,950 range after which we will resume the downside to the cluster of support at the $6,650-6,950 area.
$6,950 - Trend line
$6,770 - Horizontal support line
$6,650 - TD support
I expect this area to hold on this daily downtrend and reverse from there.
Weekly: Down
Daily: Down
4 hour: Up
1 hour: Up
Prediction for the day
Upwards move to the $7,850-7,950.
The bounce will be invalidated if we break $7,500 to the downside.
If you don't have a BitMEX account yet please use this link to register and get 10% off commissions:
https://www.bitmex.com/register/WGhKhX
Signup for the first fully decentralized ALT coin exchange:
https://www.altcoin.io?kid=KAVYG