TRX Technical Analysis | Best buying Opertunity | Reversal upcoming | Why i'm bullish on TRX
In this blog I'll share my Technical analysis on TRX and why i'm bullish on TRX.
Historical Price Action
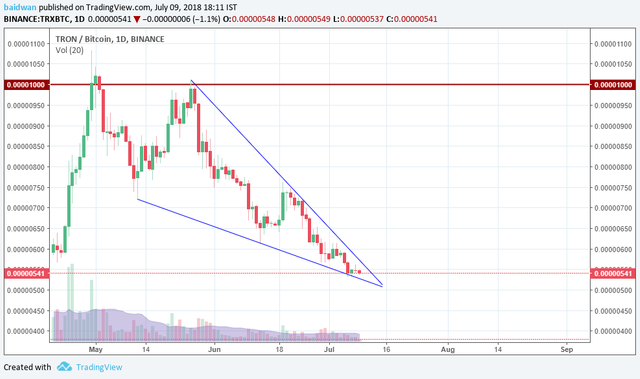
After forming the Double-Top pattern on 1-Day chart at 1000 satoshi. TRX is in downward trend. In the Mainnet Hype Tron has shown a bull run from 350 satoshi to 1070 satoshi which is more than 200% rise in its price. But after the mainnet launch TRX is in downward trend and almost 50% down from its recent high. But now TRX chart is showing some nice setups for next bull run.
TRX Technical Analysis

As show in chart TRX is moving in a Falling Wedge. Before talking about the price action let's know about what is falling wedge ?
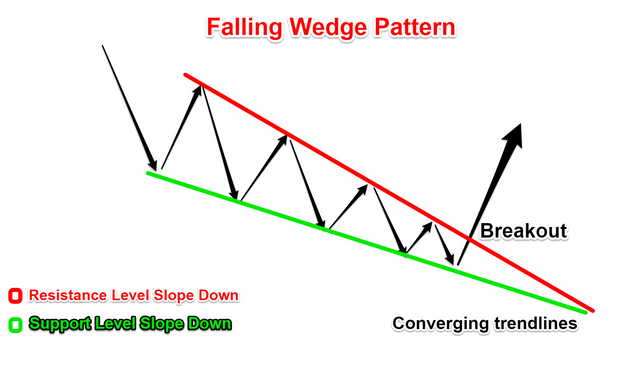
A Falling Wedge is a Bullish pattern. In this pattern the price makes lower highs and lower lows with tightening the range and the breakout happens. Most of the times it breaks above and reverse the trend. A general Falling wedge is shown below

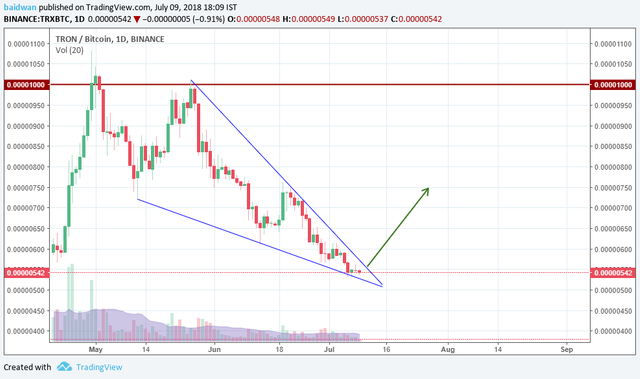
Now Lets talk about TRX. TRX is forming the same pattern as shown above and most likely it may break above and we will se some good price action after the breakout.
Currently TRX price is around 545 satoshi and it is bouncing from the support line of the Falling Wedge. In next couple of days we can see TRX will test the Resistance line of the wedge. If it breaks this resistance line we'll see some signs of bull run in TRX price.
What are your thoughts about TRX Please let me know in the comment section
Hit upvote button if you found value in this content

Congratulations @crypto-learning! You received a personal award!
You can view your badges on your Steem Board and compare to others on the Steem Ranking
Vote for @Steemitboard as a witness to get one more award and increased upvotes!