Ethereum Trades In Short Term Consolidation Phase – Which Direction Will We Break?

- Ethereum saw a decent 7% price increase over the past 7-days, however, it still failed to break the 2020 resistance at $186.
- The cryptocurrency is now moving sideways as it starts to form a short term consolidation pattern.
Ethereum was unable to overcome resistance at $279 during the past 24 hours of trading. The cryptocurrency reversed from here as it drops back beneath $270 to reach $268.50.
Despite the 7% weekly price increase, Ethereuum is starting to trade sideways within a short term symmetrical triangle pattern and will need to break this pattern to dictate the next direction it would be heading.
Ethereum Price Analysis
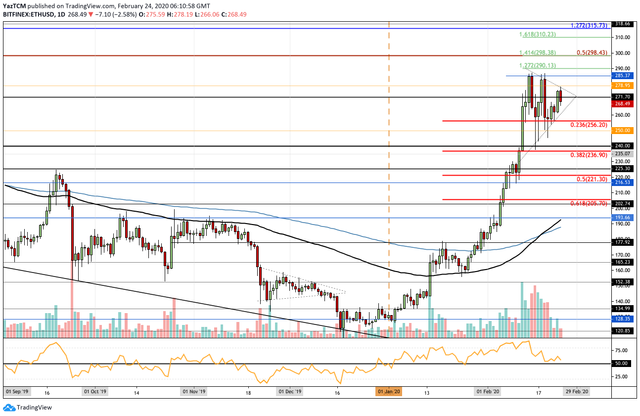
ETH/USD – Daily CHART – SHORT TERM
Market Overview
Since our last analysis, we can see that ETH bounced higher from the support at $256.20, provided by the short term .236 Fib Retracement, as it started to climb higher. It climbed as high as $278.95, however, it was unable to overcome this resistance and started to fall.
We can see that ETH is now forming the making of a short term symmetrical triangle pattern. A break of this pattern will dictate the next direction that ETH will be heading within.
Short term prediction: BULLISH
Ethereum still remains bullish at this time, however, it is in danger of turning neutral if it does break beneath this short term consolidation pattern. It would need to drop beneath $200 for the market to be considered as bearish.
If the sellers push lower, the first level of support is expected at the lower boundary of the symmetrical triangle. Beneath this, additional support lies at $256.20 (.236 Fib Retracement), $250, and $240.
On the other hand, if the bulls push higher, the first level of resistance lies at $279 and the upper boundary of the triangle. Above this, resistance lies at the 2020 high at around $286, $290 (1.272 Fib Extension), and $298 (long term bearish .5 Fibonacci Retracement).
The RSI is falling which is a sign that the bullish momentum is fading. It still remains above the 50 level, however, if it breaks beneath, the bearish momentum will start to gain control over the market.
Key Levels:
Support: $256, $250, $247, $240, $235, $230.
Resistance: $278, $285, $290, $298, $300, $310, $314, $334.
Image from TradingView
Follow CoinGape on social media handles and stay updated!
Telegram | Twitter | Medium