Can The Bulls Break $230 To Push ETH Back Toward $250?

- Ethereum is currently in an attempt to rebound from the support at the .5 Fibonacci Retracement level.
- The cryptocurrency is still down by a total of 13% over the past 7-days of trading
Ethereum has stayed quite stationary over the past 24 hours of trading as the downturn is attempting to stabilise itself at the .5 Fibonacci Retracement level in order to start the beginning of a reversal.
It had found support at the $220 level yesterday which caused Ethereum to stop the downturn and try to bounce higher. However, it is currently in a battle at $228 and this level is proving difficult to overcome.
Despite the rocky 13% price decline over the past 7-days of trading, Ethereum is still up by a total of around 28% over the previous 30 days and still up by a larger total of 81% since the start of the year.
Ethereum Price Analysis
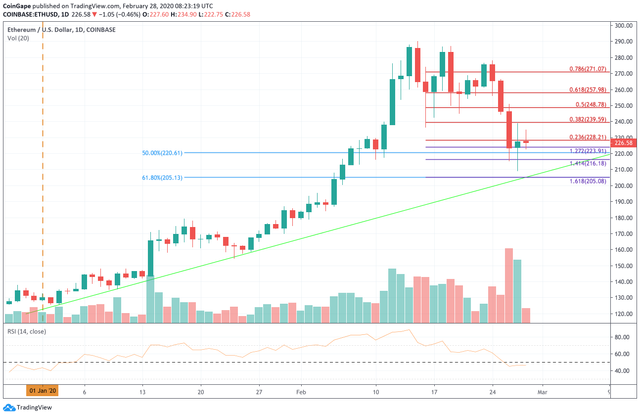
ETH/USD – Daily CHART – SHORT TERM
Market Overview
Ethereum managed to rebound at the support at $220 which is provided by a short term .5 Fibonacci Retracement level. It must break above $228 and $240 to start the making of some form of bullish recovery.
Short term prediction: NEUTRAL
Ethereum prevented itself from turning bearish over the past 24 hours after bouncing at the $220 level. It is now battling to overcome resistance at the bearish .236 Fibonacci Retracement level priced at $228.
If the buyers can break the aforementioned resistance, higher resistance is then located at $240, provided by the short term bearish .382 Fibonacci Retracement. Above this, resistance lies at $248 (bearish .5 Fib Retracement), $257 (bearish .618 Fib Retracement), and $271 (bearish .786 Fibonacci Retracement level).
On the other hand, if the sellers regroup and push ETH lower, support is located at $220. Beneath this, additional support is found at $216, provided by the downside 1.414 Fibonacci Extension level, $210, and $205 (downside 1.618 Fibonacci Extension level). The support at $205 is further bolstered by a 2-month old rising trend line as well as the .618 Fibonacci Retracement level.
Key Levels:
Support: $220, $212, $210, $201, $201, $200, $180.
Resistance: $230, $236, $240, $250, $255, $270.
Image from TradingView
Follow CoinGape on social media handles and stay updated!
Telegram | Twitter | Medium