Technical Analysis by Chartdoc
Why do we use Charts ?
Market participants act by the basic emotions of fear and greed. Charts show the sum total of the opinions of market participants.
Fundamentals don't always forecast how they will affect the price action. What we think we know about fundamentals is just our speculation. People try to find the reason in fundamentals why the market is moving in a certain direction, but the real drivers of the markets are in sum total knowable by reading the charts .
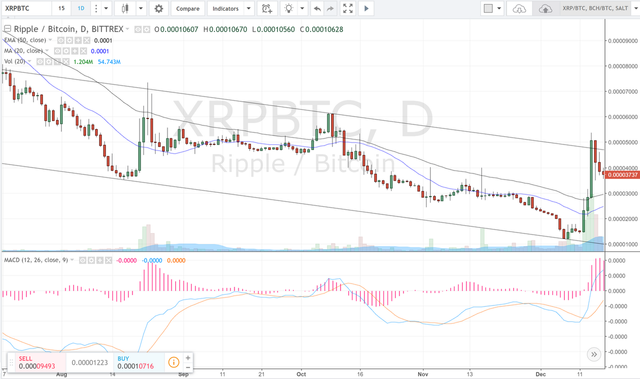
Below is the Ripple/Bitcoin chart from last year until mid-December. You can see the Ripple inside the down trend channel.
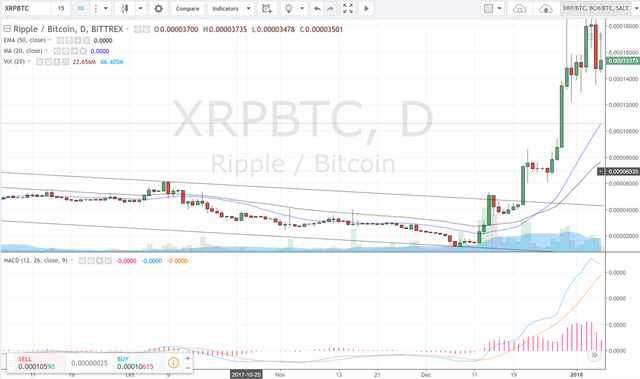
And we know what happened when it broke out of the channel.
Ripple may not be the most loved cryptocurrency, but regardless you would have made profit from riding this move if you were able to get in at the right time.
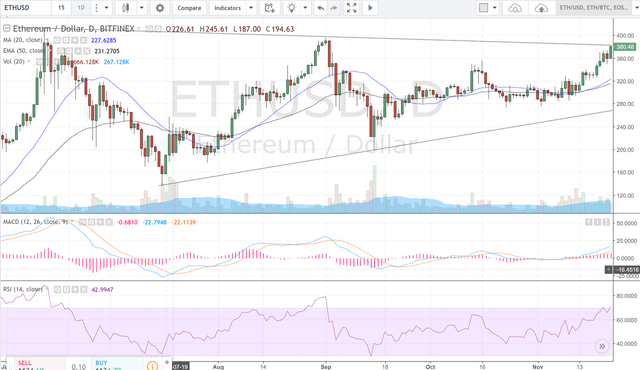
Below is the Ethereum / USD chart from last year until late November. You can see the Ethereum trading inside a triangle.
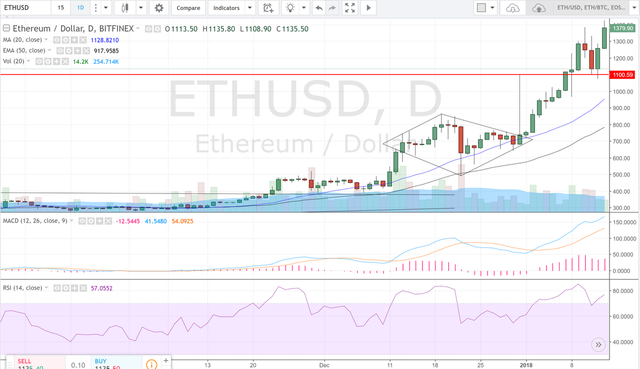
The price of Ethereum has quadrupled since, and If you were able to get in at the right time during the break out, you would be enjoying the profit, while minimizing the downside risk.
When it comes to the chart patterns, the longer it takes to build , the bigger move we see when it breaks out.
On the next issue, we will be reviewing the current charts and see what kind of opportunities lie on the horizon.
Thank you for reading today´s post. If you liked it, please give it an upvote and resteem. If you want to share your opinion, the comments section is all yours.
This document is for information and illustrative purposes only. It is not, and should not be regarded as “investment advice” or as a “recommendation” regarding a course of action, including without limitation as those terms are used in any applicable law or regulation.


